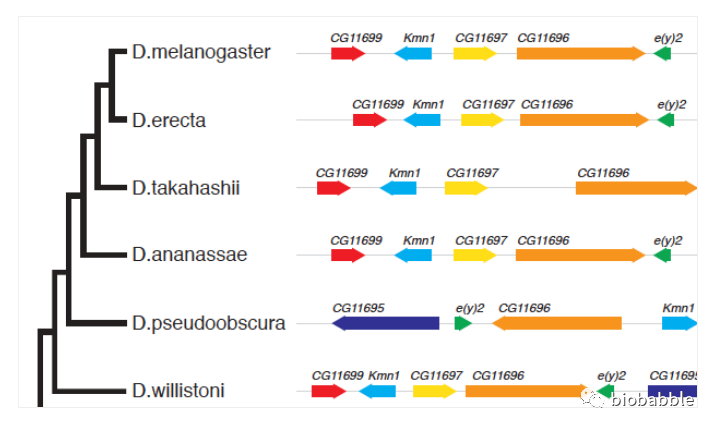
像上图这种高级货是可以使用ggtree来画的。

《潮博沙龙》系受到潮博群里大家的邀请,应邀去普及一下生信以及介绍自己的一些经历。
中国R语言大会,我到目前为止,只参加过2016年那一次,也就是第9届,那也是首次有Bioconductor分会,并且还邀请了bioconductor的老大martin morgan,我当时也是受邀请去参会的,虽然会议在人民大学举行,虽然主会场和其它分会场都是讲中文,但bioconductor分会场是要求讲英文的。因为主讲人一半是歪果仁,一半是中国人,而3个中国人之中又有两个是美帝来的,只有我一土鳖。本来邀请人跟我提了一下ChIPseeker,暗示可以讲这个包,但我强行去讲ggtree,然后会后,很多听众问我clusterProfiler的问题,也是挺尬聊的。
小伙伴发来这个图,问我是不是bug,这真是犯了程序员的社交礼仪。
你如果对一个程序员说,“你的代码有bug。” 他的第一反应是:
- 你的环境有问题吧
- 傻逼你会用吗。
如果你委婉地说:“你这个程序和预期的有点不一致,你看看是不是我的使用方法有问题。”
他本能地会想:“操,是不是出bug了!”
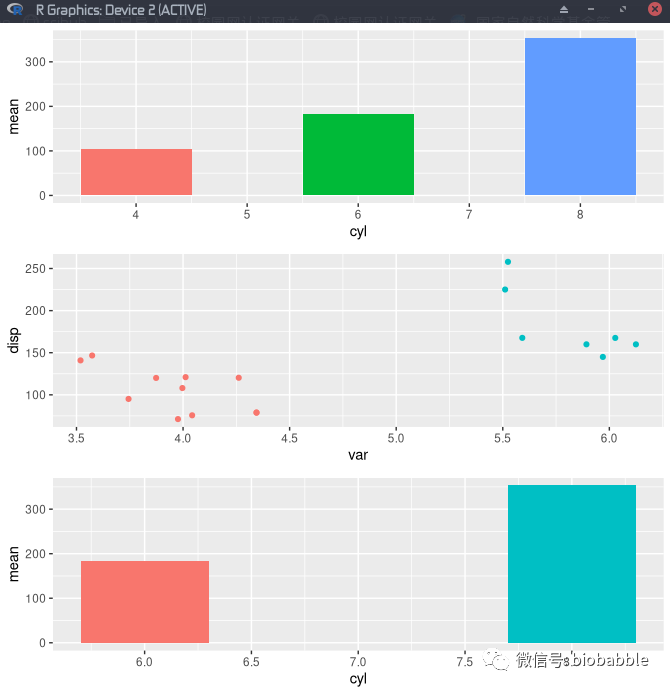
这显然不是bug,这是绝大多数人对ggplot2的误解,他们认为用xlim和ylim是放置一个窗口去看你的图,然而在ggplot2是限定一个窗口去过滤你的数据,并重新画图!你的数据被过滤了!如果是放置窗口在图上,一条线从A到B,如果B在窗口之外,那么线被截断了,你看到半条线,但如果是过滤数据呢?B不复存在,那么线条A到B也不复存在,没有B,A到B的线画不出来。就是这样,所以这绝逼不是bug,而是程序员本能反应的第二种情况,你用错了。
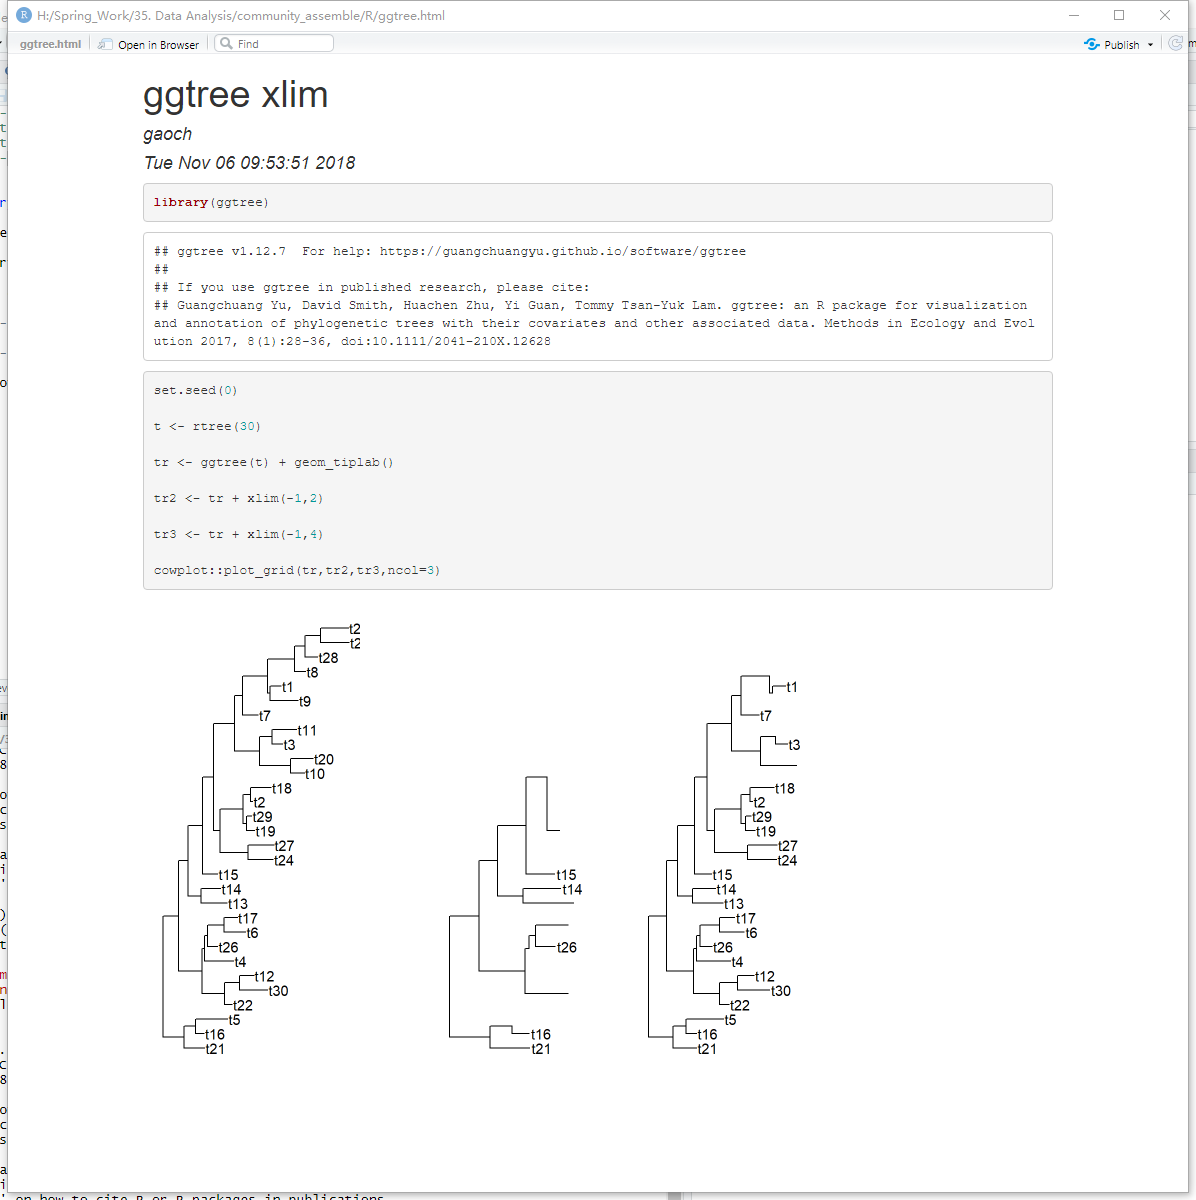
那么怎么样不过滤数据,而只是设置可视化窗口呢?你基本上很少看到有人这么用,因为几乎99%的人都只知道xlim和ylim,一般人我也不告诉他,快点拿去小抄把下面的代码记录一下。
I post this because I am facing the same problem: I want to change the text of the label (not the font, the face, the colour, etc: the text itself) of the leftmost panel which is automatically called “Tree” by ggtree. As far as I understand, and contrary to what is posted below, the “theme” thing of ggplot2 only allows to change the appearance of the panel header, not the text of the panel title itself… So how to go about that?
这是google group里的问题,说的是facet_plot会把画树的panel叫做Tree,而他想改名,于是我就写了一个函数,facet_labeller来回应这个问题。
I’ve been having great success with ggtree now and have recommended it to several colleages here in Oxford.
Is there any way to seperate the legend in heatmaps? Eg I have plotted a tree in a circular style with outer rings given extra data - I would like a seperate key for each ring - is this possible?
This is a user question. Plotting multiple heatmaps that align to the phylogenetic tree is easy with gheatmap function.
Here is a simple example:
library("ggplot2")
library("ggtree")

nwk <- system.file("extdata", "sample.nwk", package="treeio")

tree <- read.tree(nwk)
circ <- ggtree(tree, layout = "circular")

df <- data.frame(first=c("a", "b", "a", "c", "d", "d", "a", "b", "e", "e", "f", "c", "f"),
                 second= c("z", "z", "z", "z", "y", "y", "y", "y", "x", "x", "x", "a", "a"))

rownames(df) <- tree$tip.label


p1 <- gheatmap(circ, df[, "first", drop=F], offset=.8, width=.1,
               colnames_angle=90, colnames_offset_y = .25)
p2 <- gheatmap(p1, df[, "second", drop=F], offset=5, width=.1,
colnames_angle=90, colnames_offset_y = .25)Hello! First of all, I would like to thank you for this wonderful and very powerful package!
I have tried to plot a phylogenetic tree with heatmap of associated matrix (with
gheatmap). I found that the row names of matrix doesn’t exactly match to the tip names of tree in case if there is missing data in associated matrix. In other words, if we have two species (e.g., Species198 and Species1981), but only one of them is represented in the associated matrix, we will have colored cells for both species in the heatmap.