
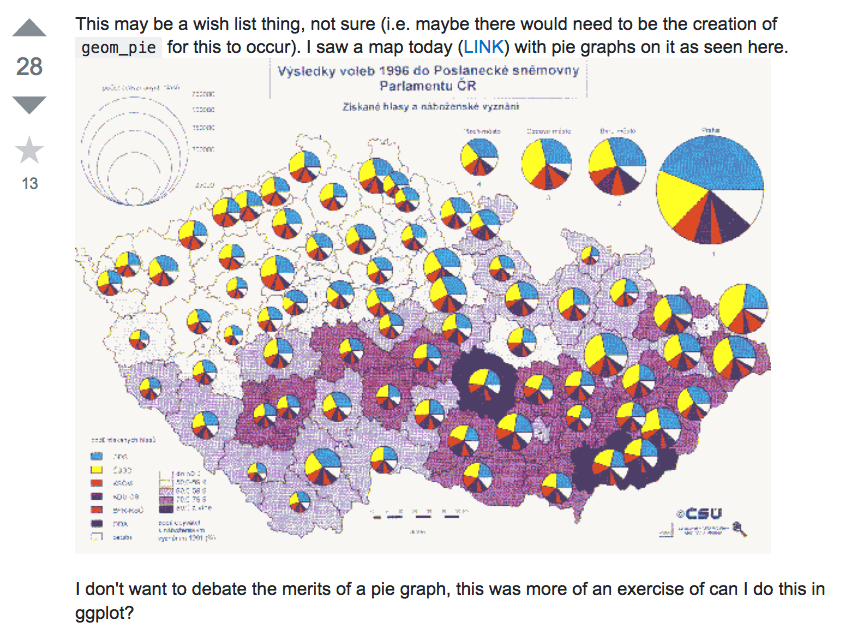
Plotting pies on ggplot/ggmap is not an easy task, as ggplot2 doesn’t provide native pie geom. The pie we produced in ggplot2 is actually a barplot transform to polar coordination. This make it difficult if we want to produce a map like the above screenshot, which was posted by Tyler Rinker, the author of R package pacman.
