
Bug of R package ChIPpeakAnno
I used R package ChIPpeakAnno for annotating peaks, and found that it handle the DNA strand in the wrong way. Maybe the developers were from the computer science but not biology background.
> require(ChIPpeakAnno)
> packageVersion("ChIPpeakAnno")
[1] '2.10.0'
> peak <- RangedData(space="chr1", IRanges(24736757, 24737528))
> data(TSS.human.GRCh37)
> ap <- annotatePeakInBatch(peak, Annotation=TSS.human.GRCh37)
> ap
RangedData with 1 row and 9 value columns across 1 space
                     space               ranges |        peak      strand
                               |
1 ENSG00000001461        1 [24736757, 24737528] |           1           +
                          feature start_position end_position insideFeature

1 ENSG00000001461 ENSG00000001461       24742284     24799466      upstream
                  distancetoFeature shortestDistance fromOverlappingOrNearest

1 ENSG00000001461             -5527             4756             NearestStart
In this example, I defined a peak ranging from chr1:24736757 to chr1:24737528 and annotated the peak using ChIPpeakAnno package.
It returns that the nearest gene is ENSG00000001461, whose gene symbol is NIPAL3.
> require(org.Hs.eg.db)
> gene.ChIPpeakAnno <- select(org.Hs.eg.db, key=ap$feature, keytype="ENSEMBL", columns=c("ENSEMBL", "ENTREZID", "SYMBOL"))
> gene.ChIPpeakAnno
          ENSEMBL ENTREZID SYMBOL
1 ENSG00000001461    57185 NIPAL3
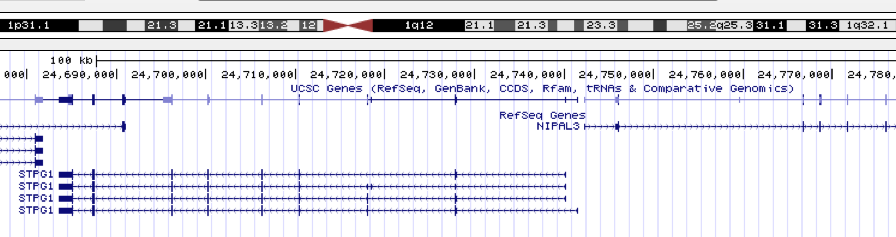
When looking at the peak in Genome Browser, I found the nearest gene is
STPG1.
 The gene symbol, STPG1, was converted to ENTREZID for future processing.
> gene.nearest <- select(org.Hs.eg.db, key="STPG1", keytype="SYMBOL", columns=c("ENSEMBL", "ENTREZID", "SYMBOL"))
> gene.nearest
  SYMBOL         ENSEMBL ENTREZID
1  STPG1 ENSG00000001460    90529
We can query the coordination of these two genes, and compare their distances to the peak.
> require(TxDb.Hsapiens.UCSC.hg19.knownGene)
> knownGene <- transcriptsBy(TxDb.Hsapiens.UCSC.hg19.knownGene, by="gene")
>
> gene.ChIPpeakAnno.info <- knownGene[[gene.ChIPpeakAnno$ENTREZID]]
> gene.ChIPpeakAnno.info
GRanges with 4 ranges and 2 metadata columns:
      seqnames               ranges strand |     tx_id     tx_name
                        |
  [1]     chr1 [24742245, 24781314]      + |       618  uc010oek.2
  [2]     chr1 [24742245, 24799473]      + |       619  uc001bjh.3
  [3]     chr1 [24742245, 24799473]      + |       620  uc009vrc.3
  [4]     chr1 [24782628, 24792864]      + |       621  uc001bji.3
  ---
  seqlengths:
                    chr1                  chr2 ...        chrUn_gl000249
               249250621             243199373 ...                 38502
After getting the information of the gene annotated by ChIPpeakAnno, I also found that the ranges of the gene is slightly different from the one returned by annotatePeakInBatch function. This may due to the variation of different versions and it’s not a big deal.
As the gene, NIPAL3, is encoded in + strand, the nearest distance is:
> min(abs(start(peak) - start(gene.ChIPpeakAnno.info)))
[1] 5488
While the gene, STPG1, is encoded in - strand, the end of the gene coordination is actually the start position of the gene and the start of the gene coordination is the end position. So the distance should be calculated by the end coordination.
> gene.nearest.info <- knownGene[[gene.nearest$ENTREZID]]
> gene.nearest.info
GRanges with 6 ranges and 2 metadata columns:
      seqnames               ranges strand |     tx_id     tx_name
                        |
  [1]     chr1 [24683489, 24700300]      - |      4706  uc010oej.2
  [2]     chr1 [24683489, 24740262]      - |      4707  uc001bja.3
  [3]     chr1 [24683489, 24740262]      - |      4708  uc001bjb.3
  [4]     chr1 [24683489, 24740262]      - |      4709  uc001bjc.3
  [5]     chr1 [24683489, 24741587]      - |      4710  uc001bjd.3
  [6]     chr1 [24695211, 24718169]      - |      4711  uc001bjf.3
  ---
  seqlengths:
                    chr1                  chr2 ...        chrUn_gl000249
               249250621             243199373 ...                 38502
> min(abs(end(peak) - end(knownGene[[gene.nearest$ENTREZID]])))
[1] 2734
STPG1 is more close to the peak than NIPAL3. Those genes encoded in - strand can’t be well-handled by ChIPpeakAnno package.
I look careful to the source code of annotatePeakInBatch function.
    TSS.ordered <- AnnotationData
    rm(AnnotationData)
    if (!length(rownames(TSS.ordered))) {
        rownames(TSS.ordered) = formatC(1:dim(TSS.ordered)[1],
            width = nchar(dim(TSS.ordered)[1]), flag = "0")
    }
    if (length(TSS.ordered$strand) == length(start(TSS.ordered))) {
        r2 = cbind(rownames(TSS.ordered), start(TSS.ordered),
            end(TSS.ordered), as.character(TSS.ordered$strand))
    }
    else {
        TSS.ordered$strand = rep("+", length(start(TSS.ordered)))
        r2 = cbind(rownames(TSS.ordered), start(TSS.ordered),
            end(TSS.ordered), rep("+", length(start(TSS.ordered))))
    }
    colnames(r2) = c("feature_id", "start_position", "end_position",
        "strand")
The AnnotationData object is provided by the package, or query from biomaRt, the length(TSS.ordered$strand) == length(start(TSS.ordered) should be TRUE, and this code should works fine. But when the expression return FALSE, the function should complain this, with warning message showing in the screen or even stop running. But the author just simply assign all the genes encoded in + strand, this is nonsense.
Then for calculating the feauture location:
    if (FeatureLocForDistance == "middle" || FeatureLocForDistance ==
        "m") {
        FeatureLoc = unlist(lapply(1:dim(r2)[1], function(i) {
            round(mean(c(as.numeric(r2[i, 2]), as.numeric(r2[i,
                3]))))
        }))
        FeatureLocForDistance = "middle"
    }
    else if (FeatureLocForDistance == "start" || FeatureLocForDistance ==
        "s") {
        FeatureLoc = r2[, 2]
        FeatureLocForDistance = "start"
    }
    else if (FeatureLocForDistance == "end" || FeatureLocForDistance ==
        "e") {
        FeatureLoc = r2[, 3]
        FeatureLocForDistance = "end"
    }
    else if (FeatureLocForDistance == "geneEnd" || FeatureLocForDistance ==
        "g") {
        FeatureLoc = unlist(lapply(1:dim(r2)[1], function(i) {
            if (as.character(r2[i, 4]) == "+" || as.character(r2[i,
                4]) == "1" || as.character(r2[i, 4]) == "*") {
                r2[i, 3]
            }
            else {
                r2[i, 2]
            }
        }))
        FeatureLocForDistance = "geneEnd"
    }
    else {
        FeatureLoc = unlist(lapply(1:dim(r2)[1], function(i) {
            if (as.character(r2[i, 4]) == "+" || as.character(r2[i,
                4]) == "1" || as.character(r2[i, 4]) == "*") {
                r2[i, 2]
            }
            else {
                r2[i, 3]
            }
        }))
        FeatureLocForDistance = "TSS"
    }
Only “geneEnd” and “TSS” types consider the strand information. For “middle”, omits the strand information should be fine, but for “start” and “end”, the “start” should be “end” and “end” should be “start” when the gene is located at - strand. Again, the annotatePeakInBatch function omits the strand information of genes/features.
        TSS.ordered$FeatureLoc = FeatureLoc
        myPeakList$PeakLoc = PeakLoc
        plusAnno = TSS.ordered[as.character(TSS.ordered$strand) %in%
            c("+", "*", "1"), ]
        minusAnno = TSS.ordered[as.character(TSS.ordered$strand) %in%
            c("-1", "-"), ]
        r1 = do.call(rbind, lapply(seq_len(numberOfChromosome),
            function(i) {
                chr = allChr[i]
                if (chr %in% allChr.Anno) {
                  featureStart = as.numeric(TSS.ordered[chr]$FeatureLoc)
                  peakLoc = as.numeric(myPeakList[chr]$PeakLoc)
                  peakStart = as.numeric(start(myPeakList[chr]))
                  peakEnd = as.numeric(end(myPeakList[chr]))
                  name = rownames(myPeakList[chr])
                  peakRanges = IRanges(start = peakStart, end = peakEnd,
                    names = name)
                  featureID = rownames(TSS.ordered[chr])
                  featureRanges = IRanges(start = featureStart,
                    end = featureStart, names = featureID)
                  nearestFeature = featureRanges[nearest(peakRanges,
                    featureRanges)]
                  data.frame(name = name, feature_id = names(nearestFeature))
                }
            }))
For identifying the nearest feature, the author use:
nearestFeature = featureRanges[nearest(peakRanges,
                    featureRanges)]
The “start” of the features should be used when it were encoded in + strand and “end” when features were encoded in - strand. But the author use nearest function which use both “start” and “end” of the interval to calculate the distance by default.
Considering the “start” and “end” records may reverse when the genes/features were encoded in - strand and the way ChIPpeakAnno calcultes the distance is too simple by using nearest function, I can’t trust their results. It’s not hard to implement a function to annotate peaks. Preparing the gene annotation and calculating the distances among genes and peaks for finding the nearest gene of the peak. That’s it.
