
visualization methods in ChIPseeker
After two weeks developed, I have added/updated some plot functions in ChIPseeker (version >=1.0.1).
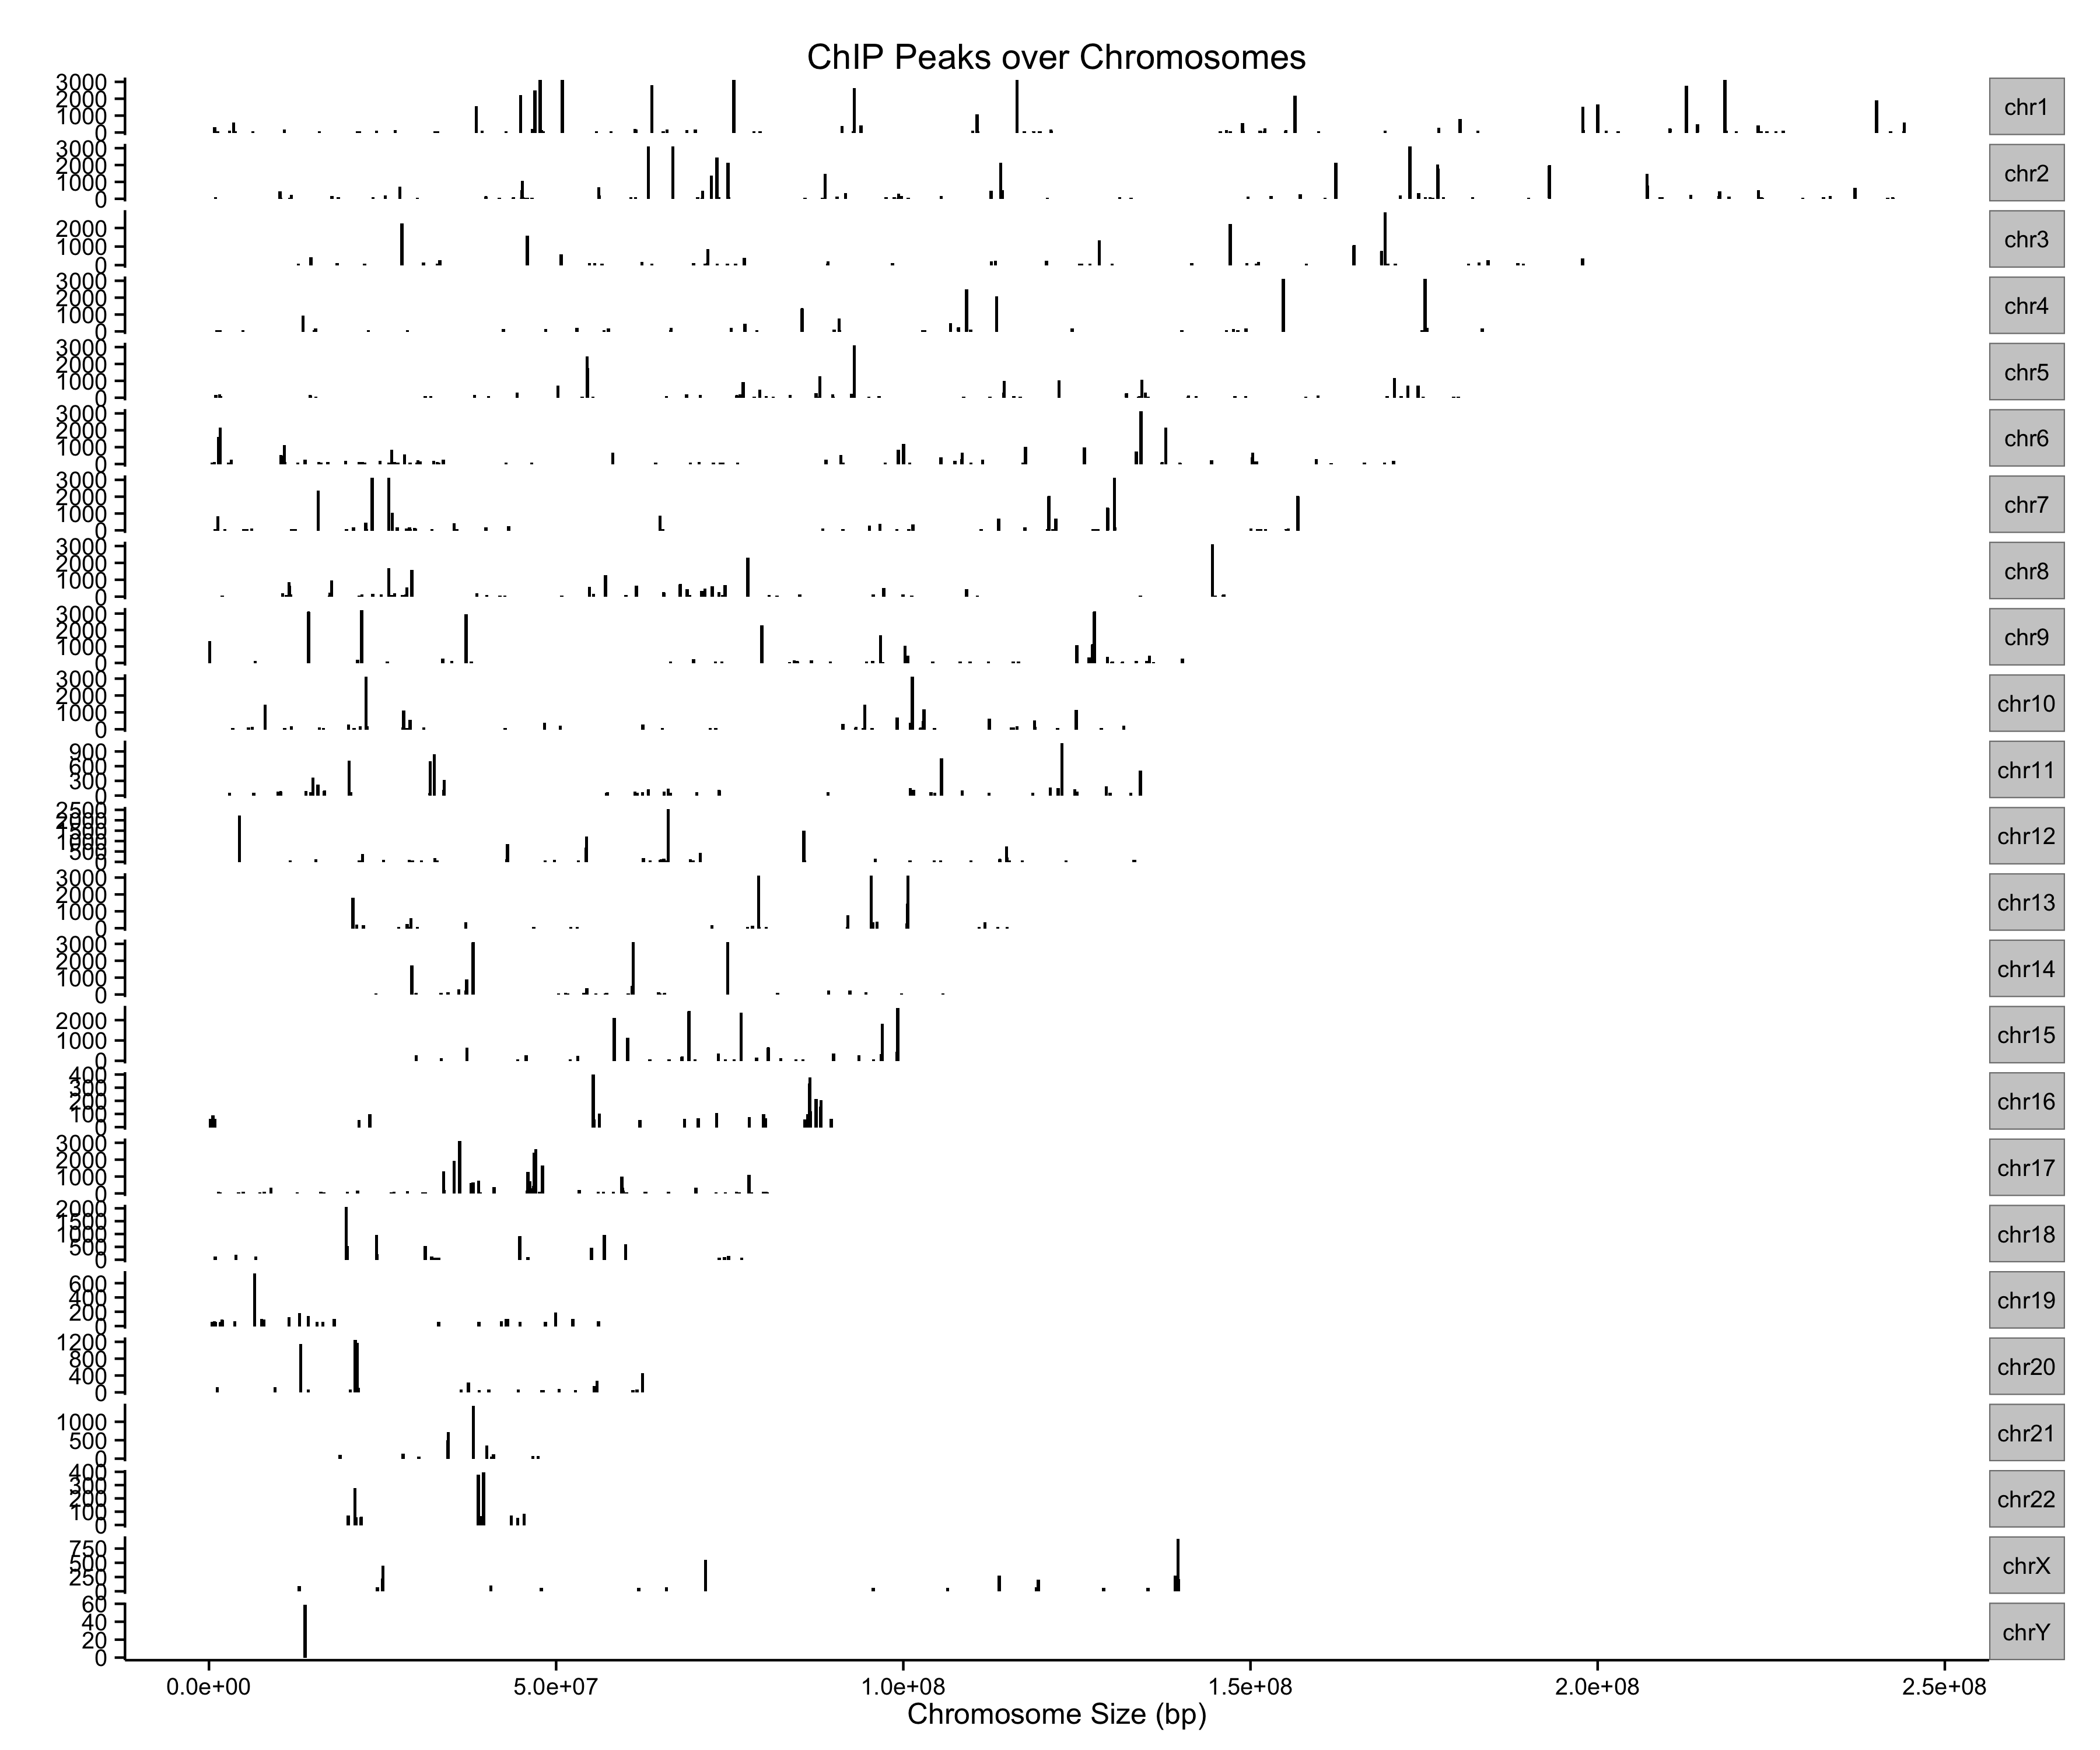
ChIP peaks over Chromosomes
> files=getSampleFiles()
> peak=readPeakFile(files[[4]])
> peak
GRanges object with 1331 ranges and 2 metadata columns:
         seqnames                 ranges strand   |             V4        V5
                               |
     [1]     chr1     [ 815092,  817883]      *   |    MACS_peak_1    295.76
     [2]     chr1     [1243287, 1244338]      *   |    MACS_peak_2     63.19
     [3]     chr1     [2979976, 2981228]      *   |    MACS_peak_3    100.16
     [4]     chr1     [3566181, 3567876]      *   |    MACS_peak_4    558.89
     [5]     chr1     [3816545, 3818111]      *   |    MACS_peak_5     57.57
     ...      ...                    ...    ... ...            ...       ...
  [1327]     chrX [135244782, 135245821]      *   | MACS_peak_1327     55.54
  [1328]     chrX [139171963, 139173506]      *   | MACS_peak_1328    270.19
  [1329]     chrX [139583953, 139586126]      *   | MACS_peak_1329    918.73
  [1330]     chrX [139592001, 139593238]      *   | MACS_peak_1330    210.88
  [1331]     chrY [ 13845133,  13845777]      *   | MACS_peak_1331     58.39
  ---
  seqlengths:
    chr1 chr10 chr11 chr12 chr13 chr14 ...  chr6  chr7  chr8  chr9  chrX  chrY
      NA    NA    NA    NA    NA    NA ...    NA    NA    NA    NA    NA    NA
> covplot(peak, weightCol="V5")
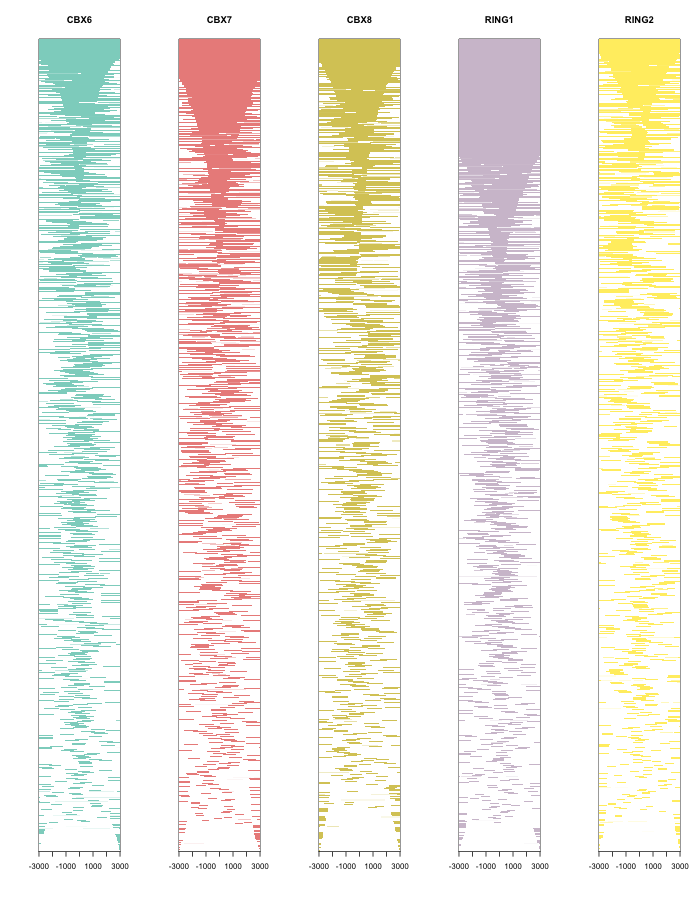
Heatmap of ChIP binding to TSS regions
require(TxDb.Hsapiens.UCSC.hg19.knownGene)
txdb <- TxDb.Hsapiens.UCSC.hg19.knownGene
peakHeatmap(files, weightCol="V5", TxDb=txdb, upstream=3000, downstream=3000, color=rainbow(length(files)))
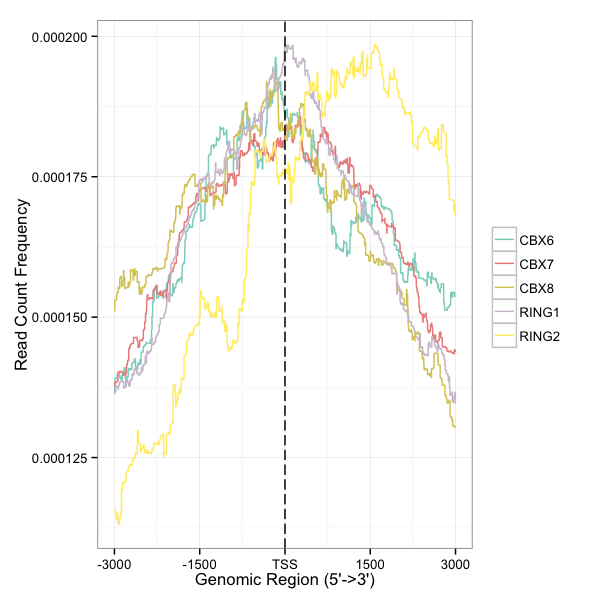
Average Profile of ChIP peaks binding to TSS region
plotAvgProf(files, TranscriptDb=txdb, weightCol="V5", upstream=3000, downstream=3000)
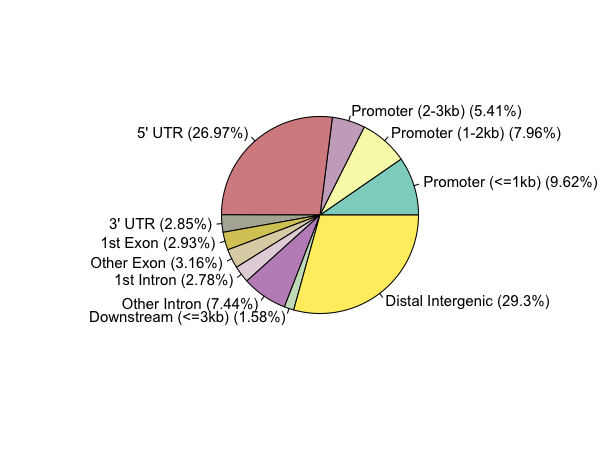
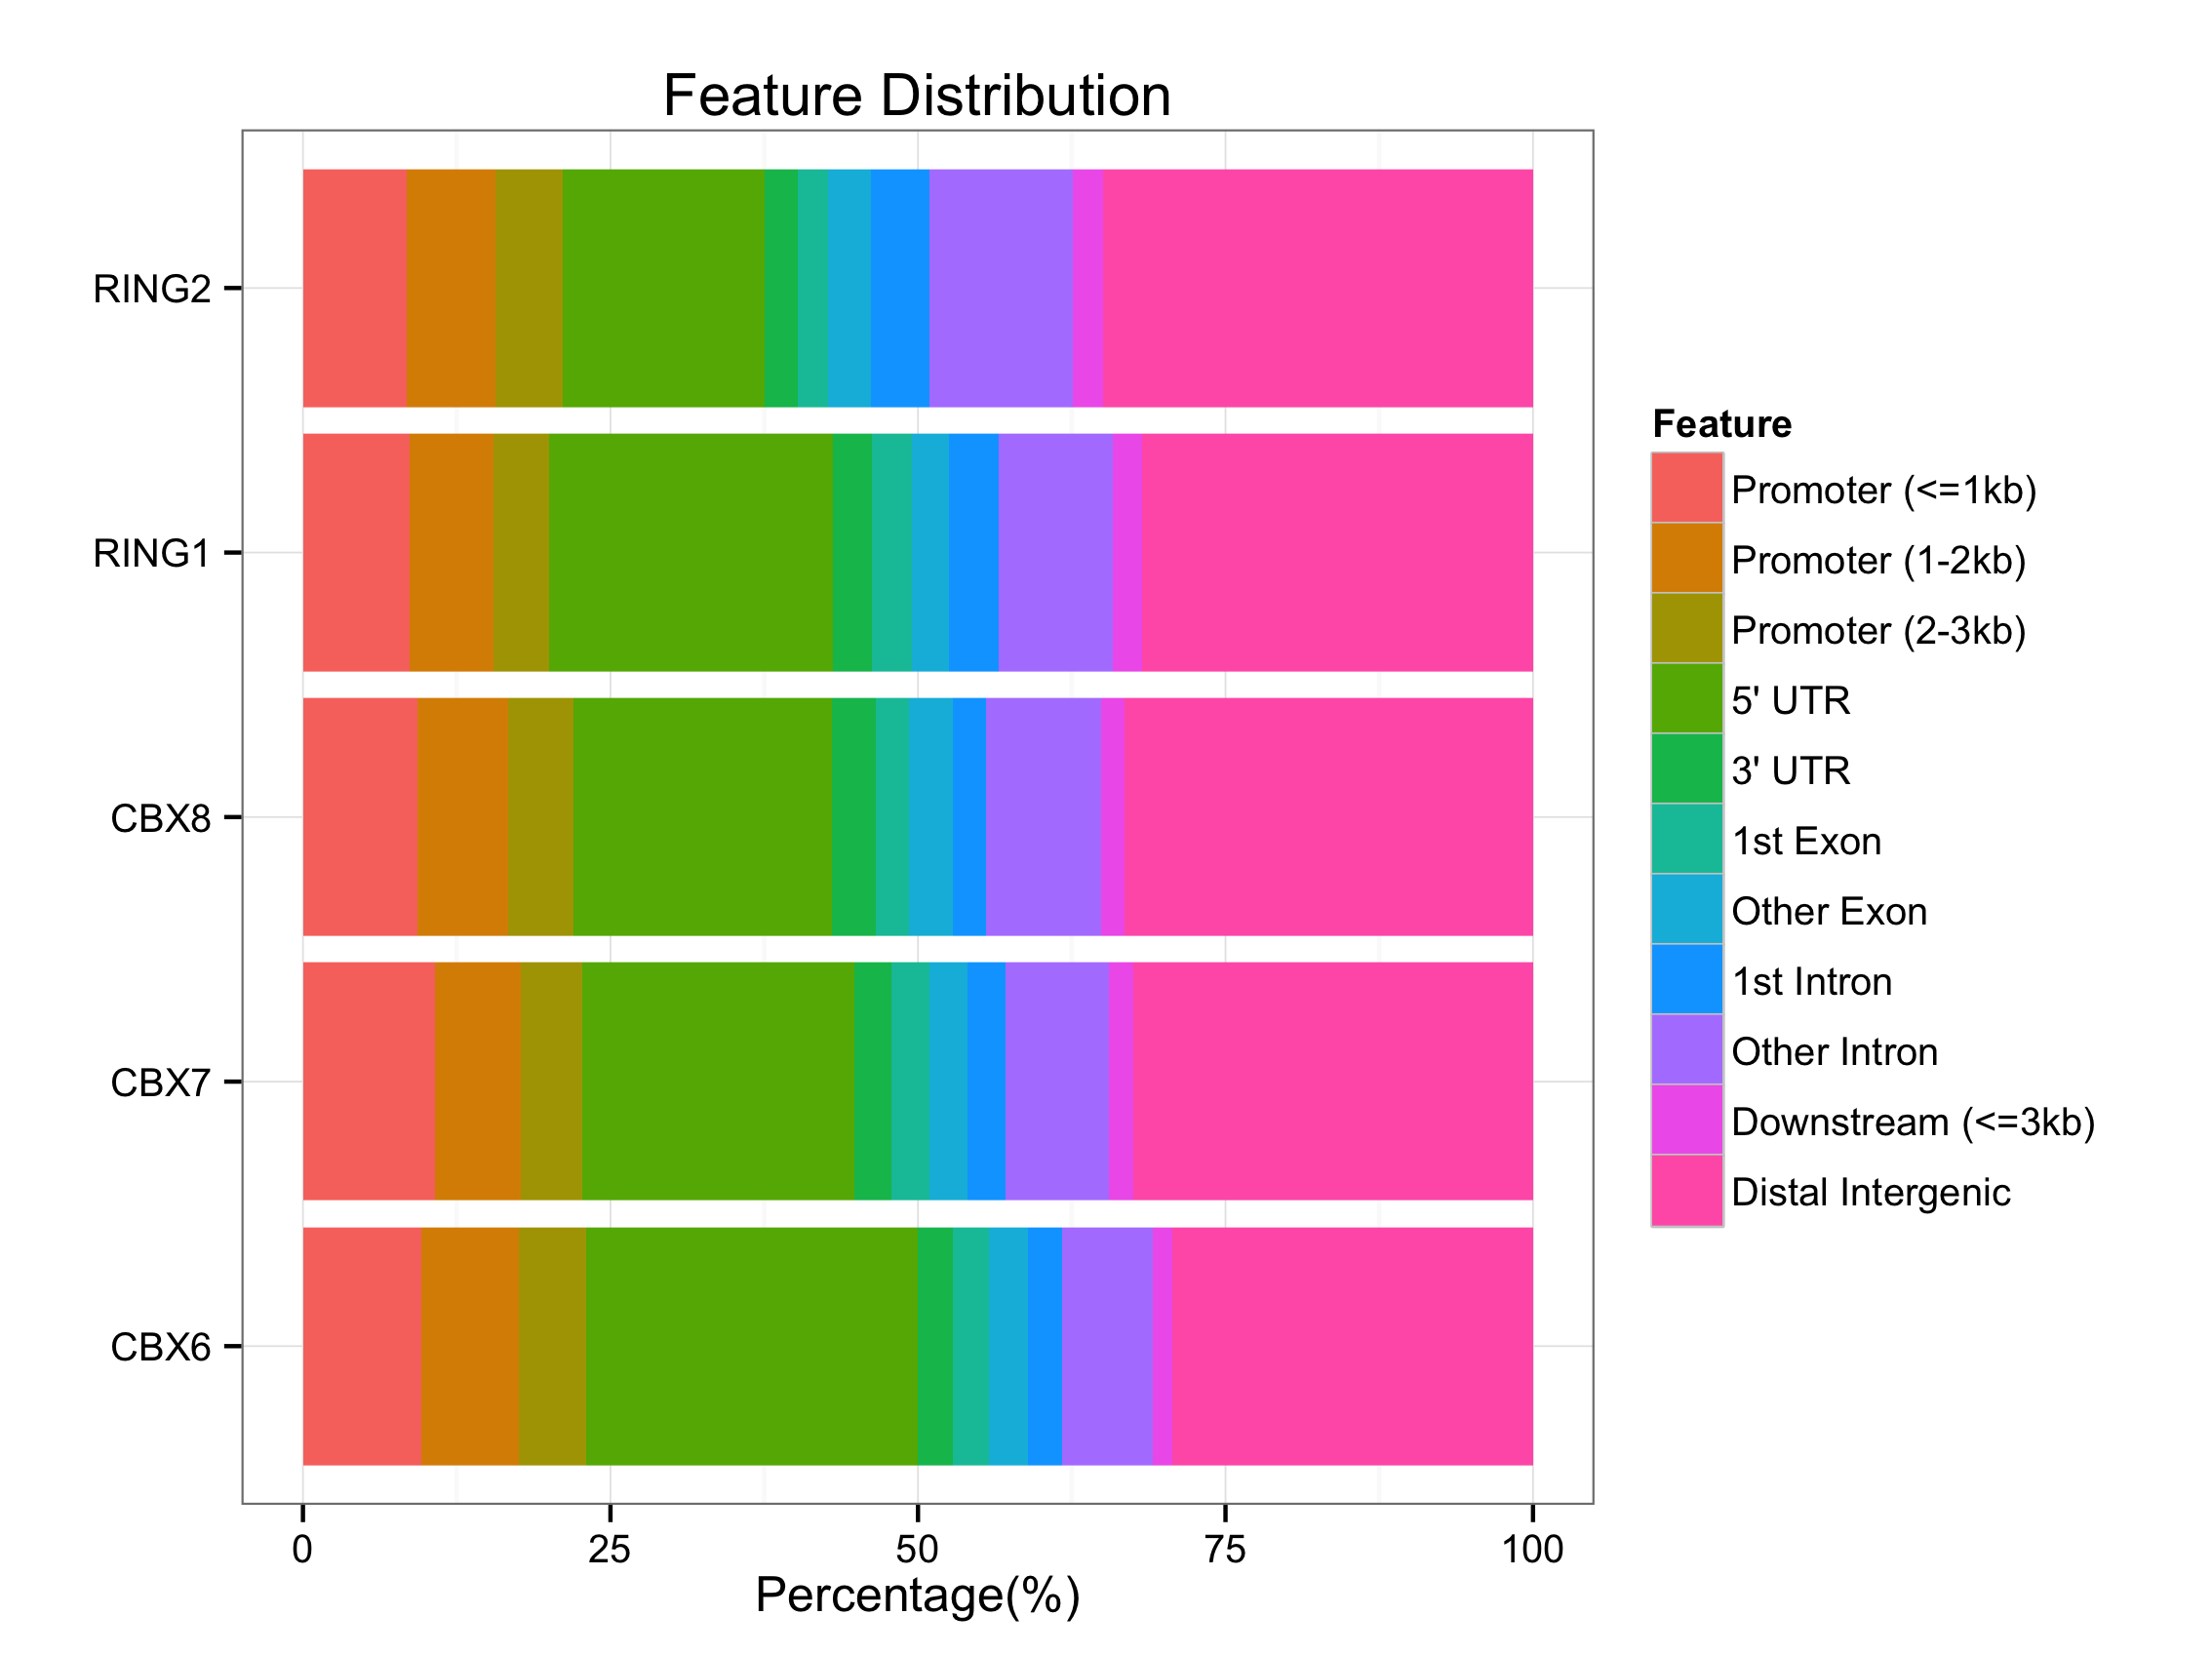
Genomic Annotation
peakAnnoList=lapply(files, annotatePeak)
plotAnnoPie(peakAnnoList[[1]])
plotAnnoBar(peakAnnoList)
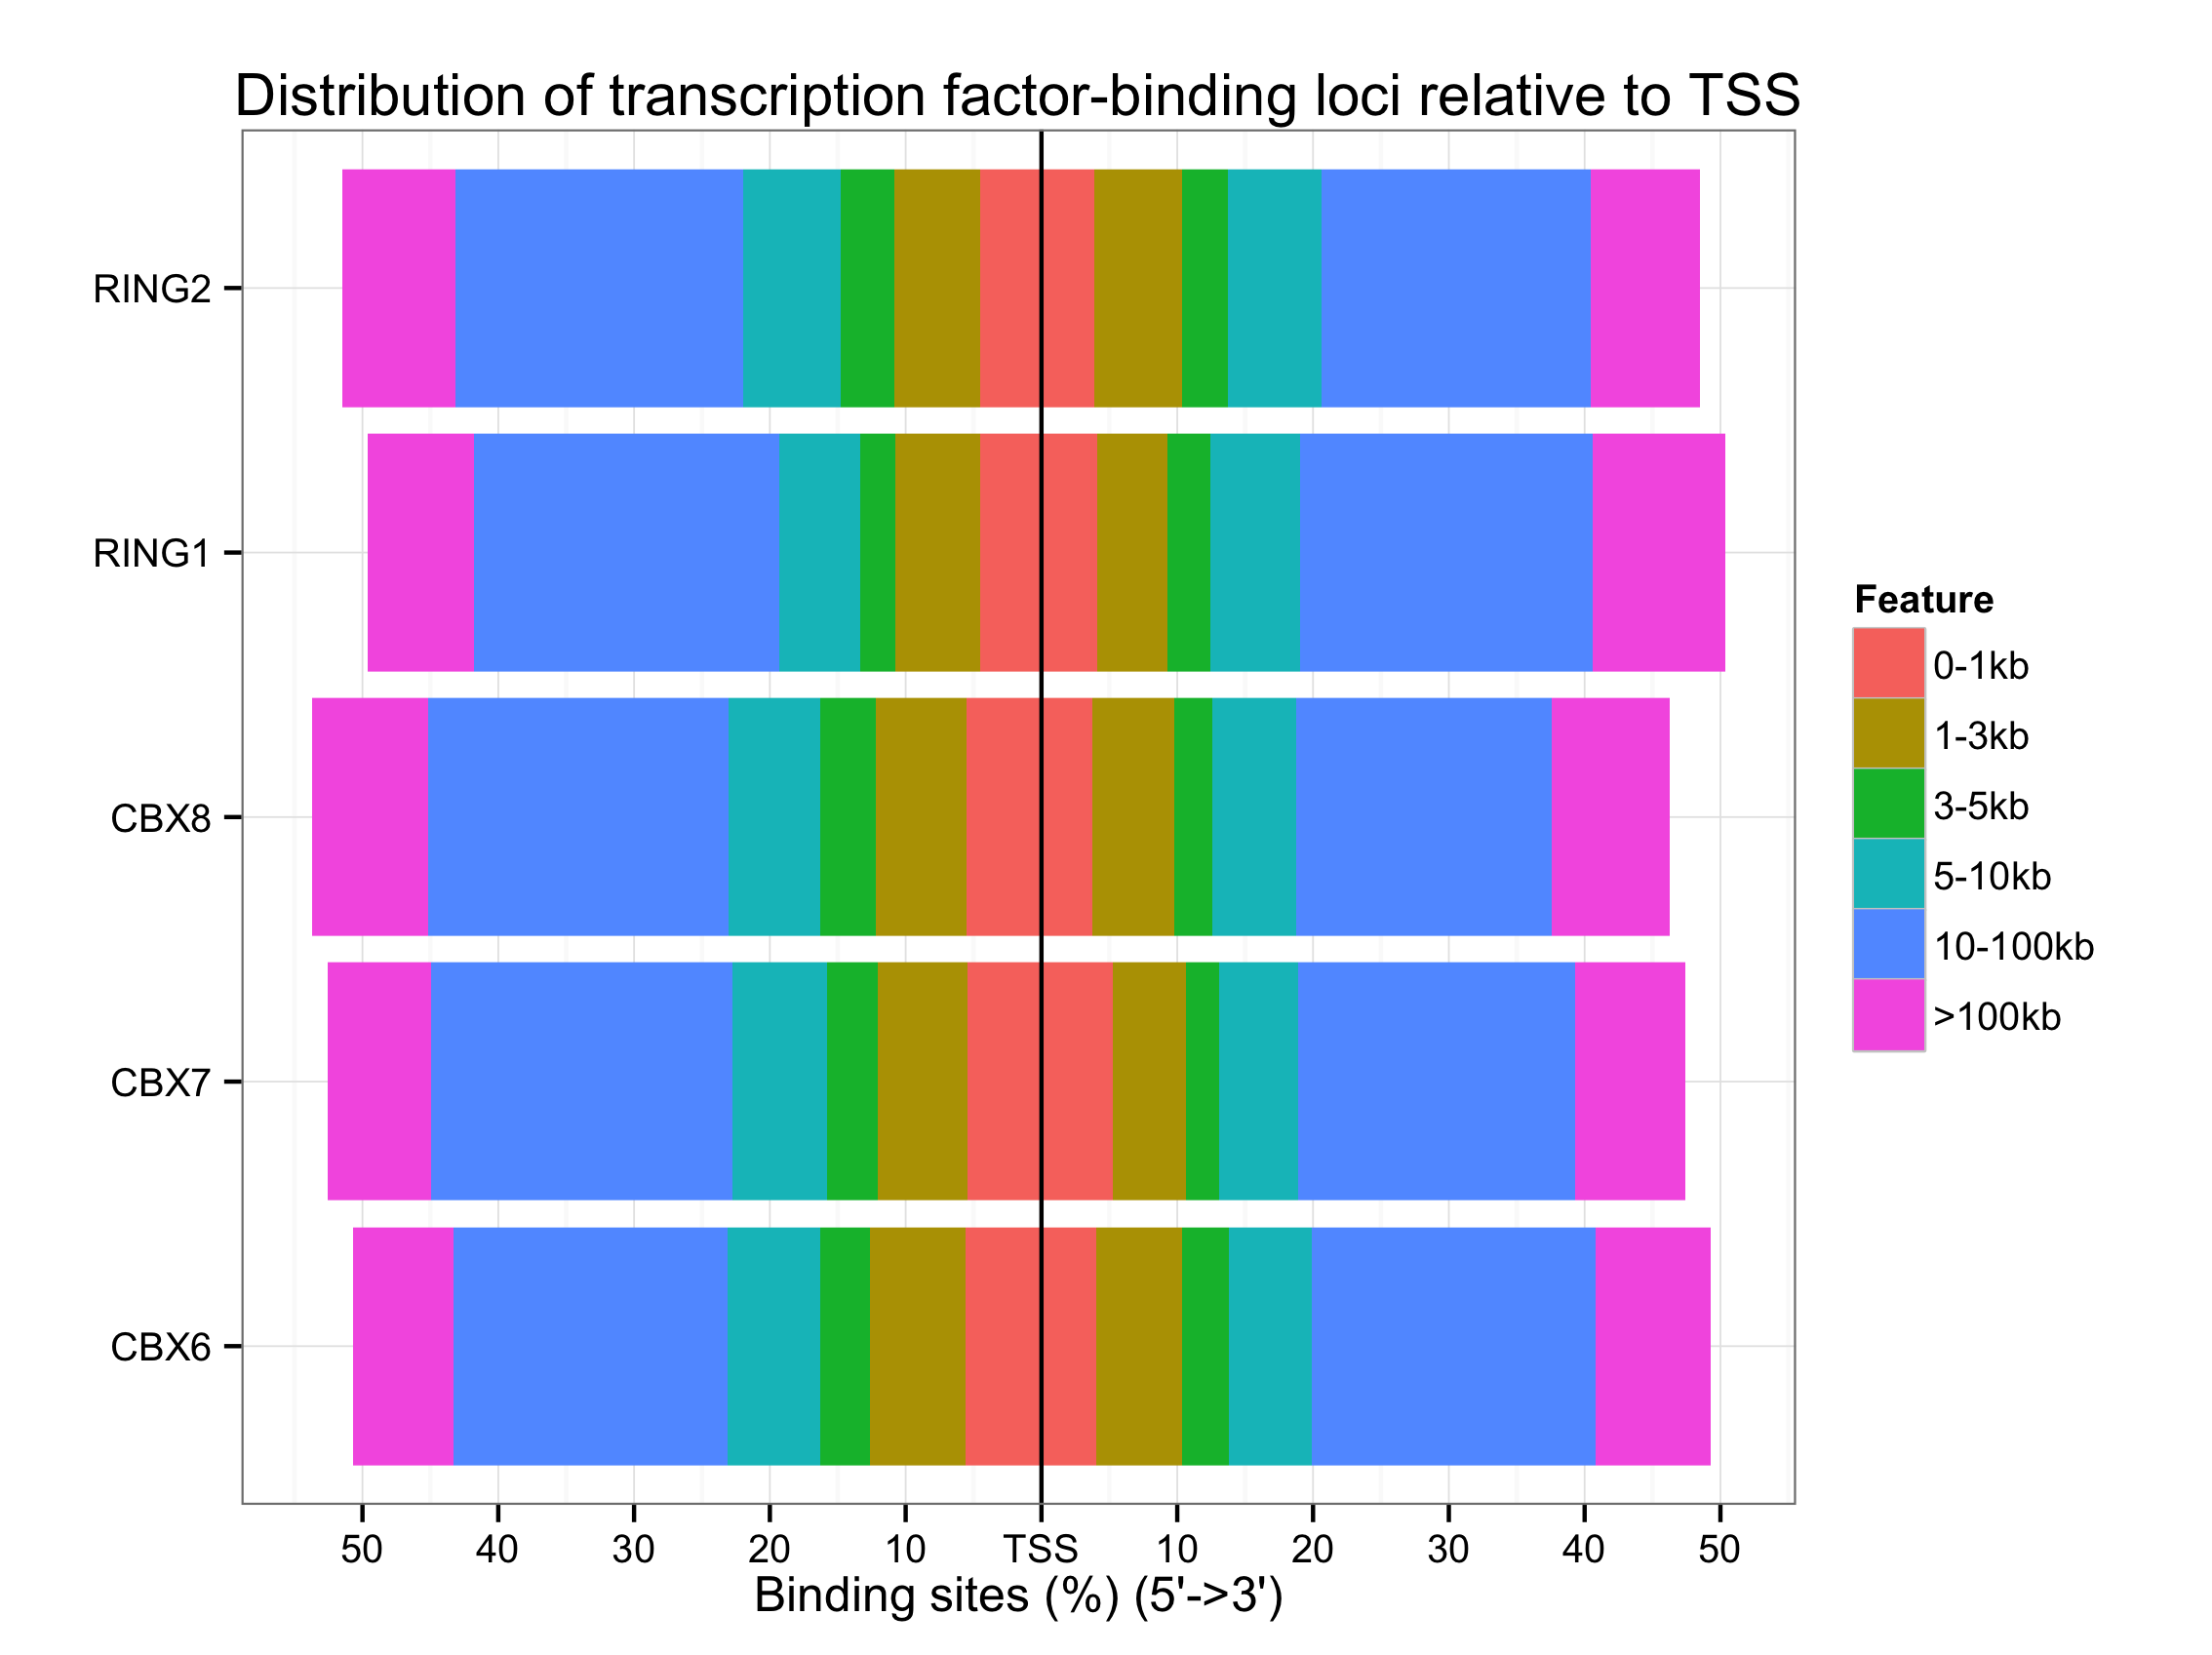
Distance to TSS
plotDistToTSS(peakAnnoList)
Overlap of peak sets
genes= lapply(peakAnnoList, function(i) as.data.frame(i)$geneId)
vennplot(genes)
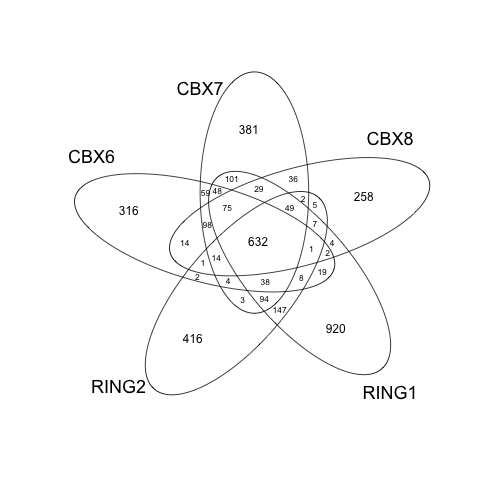
In the future version, ChIPseeker will support statistical comparison among ChIP peak sets, and incorporate open access database GEO for users to compare their own dataset to those deposited in database. Significant overlap among peak sets can be used to infer cooperative regulation. This feature will soon be available.
Citation
Yu G, Wang LG and He QY*. ChIPseeker: an R/Bioconductor package for ChIP peak annotation, comparison and visualization. Bioinformatics 2015, 31(14):2382-2383.
