
align genomic features with phylogenetic tree
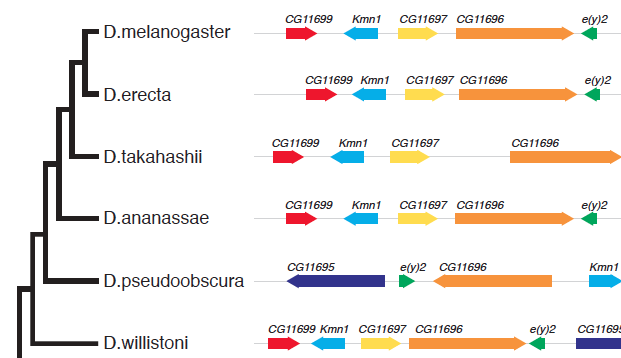
A question on biostars asking how to generate the following figure:
This can be quite easy to implement in ggtree, I can write a geom layer to layout the alignment. As ggbio already provides many geom for genomic data and I don’t want to re-invent the wheel, I decided to try ggtree+ggbio. This is also the beauty of R that packages complete each others.
Here is a sample data presented in ggbio vignette:
library(ggbio)
library(biovizBase)
library(Homo.sapiens)
library(TxDb.Hsapiens.UCSC.hg19.knownGene)
txdb <- TxDb.Hsapiens.UCSC.hg19.knownGene

data(genesymbol, package = "biovizBase")
wh <- genesymbol[c("BRCA1", "NBR1")]
wh <- range(wh, ignore.strand = TRUE)

gr.txdb <- crunch(txdb, which = wh)
## change column to  model
colnames(values(gr.txdb))[4] <- "model"
grl <- split(gr.txdb, gr.txdb$tx_id)
set.seed(2016-10-25)
names(grl) <- sample(LETTERS, size = length(grl), replace = TRUE)
> print(grl)
GRangesList object of length 32:
$J
GRanges object with 7 ranges and 4 metadata columns:
      seqnames               ranges strand |    tx_id    tx_name
         <Rle>            <IRanges>  <Rle> | <factor>   <factor>
  [1]    chr17 [41277600, 41277787]      + |    61241 uc002idf.3
  [2]    chr17 [41283225, 41283287]      + |    61241 uc002idf.3
  [3]    chr17 [41284973, 41285154]      + |    61241 uc002idf.3
  [4]    chr17 [41290674, 41292342]      + |    61241 uc002idf.3
  [5]    chr17 [41277788, 41283224]      * |    61241 uc002idf.3
  [6]    chr17 [41283288, 41284972]      * |    61241 uc002idf.3
  [7]    chr17 [41285155, 41290673]      * |    61241 uc002idf.3
       gene_id    model
      <factor> <factor>
  [1]    10230     exon
  [2]    10230     exon
  [3]    10230     exon
  [4]    10230     exon
  [5]    10230      gap
  [6]    10230      gap
  [7]    10230      gap

$U
GRanges object with 3 ranges and 4 metadata columns:
      seqnames               ranges strand | tx_id    tx_name
  [1]    chr17 [41277600, 41277787]      + | 61242 uc010czb.2
  [2]    chr17 [41290674, 41292342]      + | 61242 uc010czb.2
  [3]    chr17 [41277788, 41290673]      * | 61242 uc010czb.2
      gene_id model
  [1]   10230  exon
  [2]   10230  exon
  [3]   10230   gap

$D
GRanges object with 9 ranges and 4 metadata columns:
      seqnames               ranges strand | tx_id    tx_name
  [1]    chr17 [41277600, 41277787]      + | 61243 uc002idg.3
  [2]    chr17 [41283225, 41283287]      + | 61243 uc002idg.3
  [3]    chr17 [41290674, 41290939]      + | 61243 uc002idg.3
  [4]    chr17 [41291833, 41292300]      + | 61243 uc002idg.3
  [5]    chr17 [41296745, 41297125]      + | 61243 uc002idg.3
  [6]    chr17 [41277788, 41283224]      * | 61243 uc002idg.3
  [7]    chr17 [41283288, 41290673]      * | 61243 uc002idg.3
  [8]    chr17 [41290940, 41291832]      * | 61243 uc002idg.3
  [9]    chr17 [41292301, 41296744]      * | 61243 uc002idg.3
      gene_id model
  [1]   10230  exon
  [2]   10230  exon
  [3]   10230  exon
  [4]   10230  exon
  [5]   10230  exon
  [6]   10230   gap
  [7]   10230   gap
  [8]   10230   gap
  [9]   10230   gap

...
<29 more elements>
-------
seqinfo: 1 sequence from hg19 genome
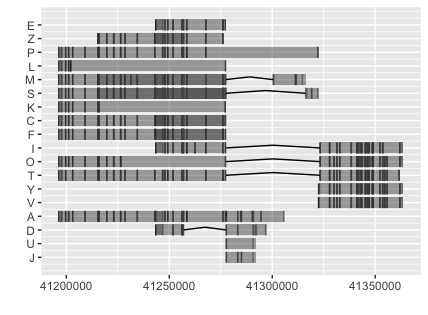
We can visualize the alignment simply using:
ggplot() + geom_alignment(grl, alpha=.5)
The input data for geom_alignment is a GRangesList object, while facet_plot defined in ggtree expect the input data as a data.frame. I extend the facet_plot to work with geom_alignment. In doing this, I find a bug of the geom_alignment function and send a patch to Michael. My patch was incorporated in ggbio 1.23.2.
With the updates of both ggtree and ggbio, we can use facet_plot to align alignment with phylogenetic tree.
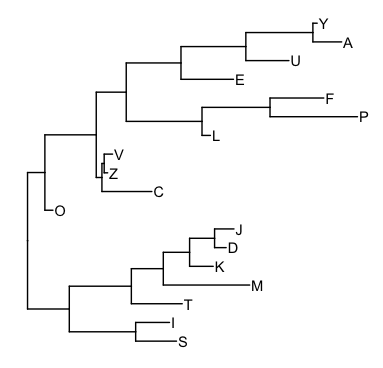
Suppose we have the following tree:
library(ggtree)
n <- names(grl) %>% unique %>% length
set.seed(2016-10-25)
tr = rtree(n)
set.seed(2016-10-25)
tr$tip.label = sample(unique(names(grl)), n)

p <- ggtree(tr) + geom_tiplab()
It is quite easy to use facet_plot to visualize the above alignment with this tree:
facet_plot(p, 'alignment', grl, geom_alignment, inherit.aes=FALSE, mapping=aes())
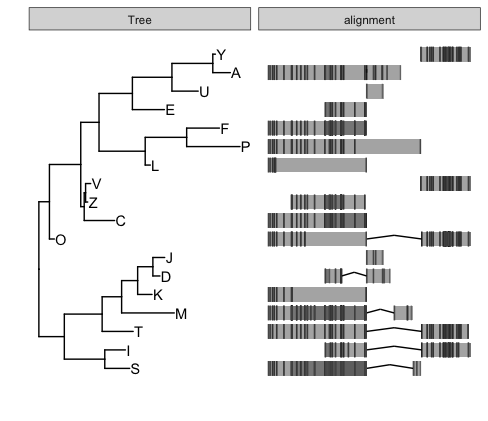
Beware of mapping=aes() is required as ggbio can’t accept mapping=NULL.
PS: I only test geom_alignment which works with GRanges and GRangesList. Other geoms defined in ggbio may not be supported. If you find facet_plot fail to work with other geoms, please open an issue in github. Feature requests are welcome.
Citation
G Yu, DK Smith, H Zhu, Y Guan, TTY Lam*. ggtree: an R package for visualization and annotation of phylogenetic trees with their covariates and other associated data. Methods in Ecology and Evolution. doi:10.1111/2041-210X.12628.
