
Edge coloring with user data
Coloring edges in ggtree is quite easy, as we can map the color to numerical or categorical values via the aes(color=VAR) syntax. For user’s own data, it is also easy as ggtree provide the %<+% operator to attach user data.
But as it seems not so obviously for ggtree users, see question 1, 2, and 3, I will demonstrate how to color edges using user data here.
There are several solutions to this question. Let’s first start with a hard one by using phylo4d class defined by phylobase package:
require(ggtree)
require(phylobase)

set.seed(123)
tr = rtree(30)
g1 = as(tr, 'phylo4')
d = data.frame(color=sample(c('red', 'blue', 'green'), 30, replace=T))
rownames(d) = tr$tip.label
g2 = phylo4d(g1, d)

rNodeData <- data.frame(randomTrait = rnorm(nNodes(g1)),
                        color = sample(c('purple', 'yellow', 'black'), nNodes(g1), replace=T),
                        row.names = nodeId(g1, "internal"))

nodeData(g2) <- rNodeData
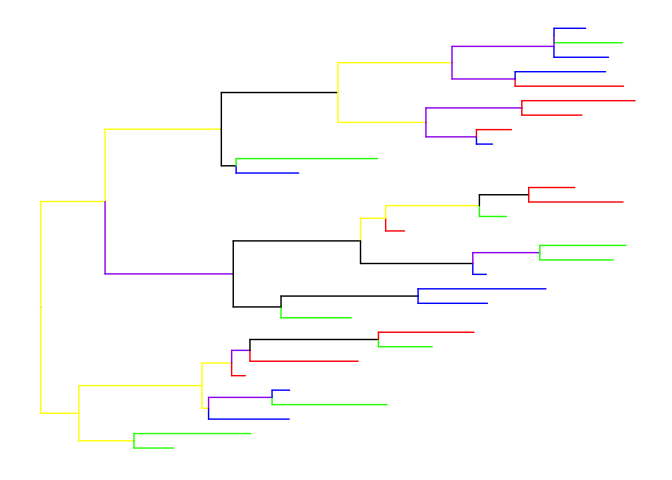
We can store the information in a phylo4d object and as this object is supported by ggtree. We can directly coloring the tree by mapping the color to specific variable.
ggtree(g2, aes(color=I(color)))
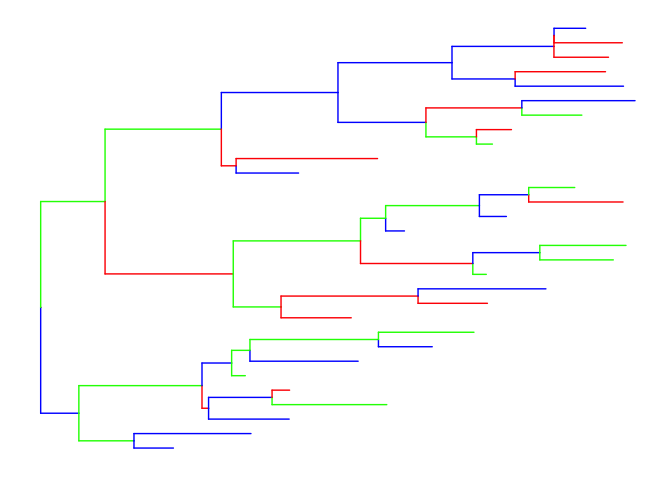
ggtree itself also provide solution by using the operator, %<+% to attach user data. After attaching, we can re-scale edge color by aes.
d = data.frame(node=1:59, color=sample(c('red', 'blue', 'green'), 59, replace=T))
ggtree(tr) %<+% d + aes(color=I(color))
Citation
G Yu, DK Smith, H Zhu, Y Guan, TTY Lam*. ggtree: an R package for visualization and annotation of phylogenetic trees with their covariates and other associated data. Methods in Ecology and Evolution. doi:10.1111/2041-210X.12628.
