
ggtree version of plotTree
PLOTTING TREES + DATA is difficult. @DrKatHolt developed plotTree (R and Python scripts) to visualize associated data with trees, e.g. heatmap, horizontal bar etc.
I reproduced the examples presented in the plotTree repo using ggtree. Source code is freely available in https://github.com/GuangchuangYu/plotTree-ggtree.
Here are the outputs produced by ggtree:
Tree with basic strain info

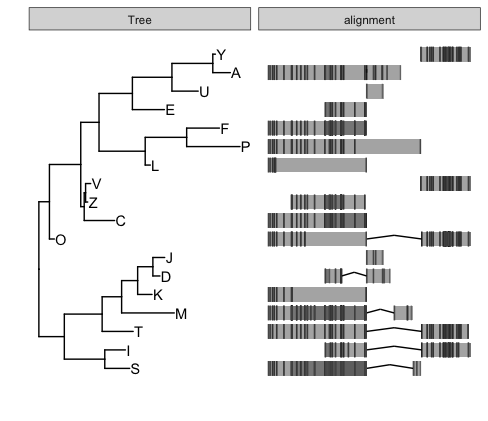
Pan genome heatmap

Curated genes, coloured

It can be very easy to produce a circular/fan layout version, and the tree was used to generate the ggtree hex sticker.
![]()
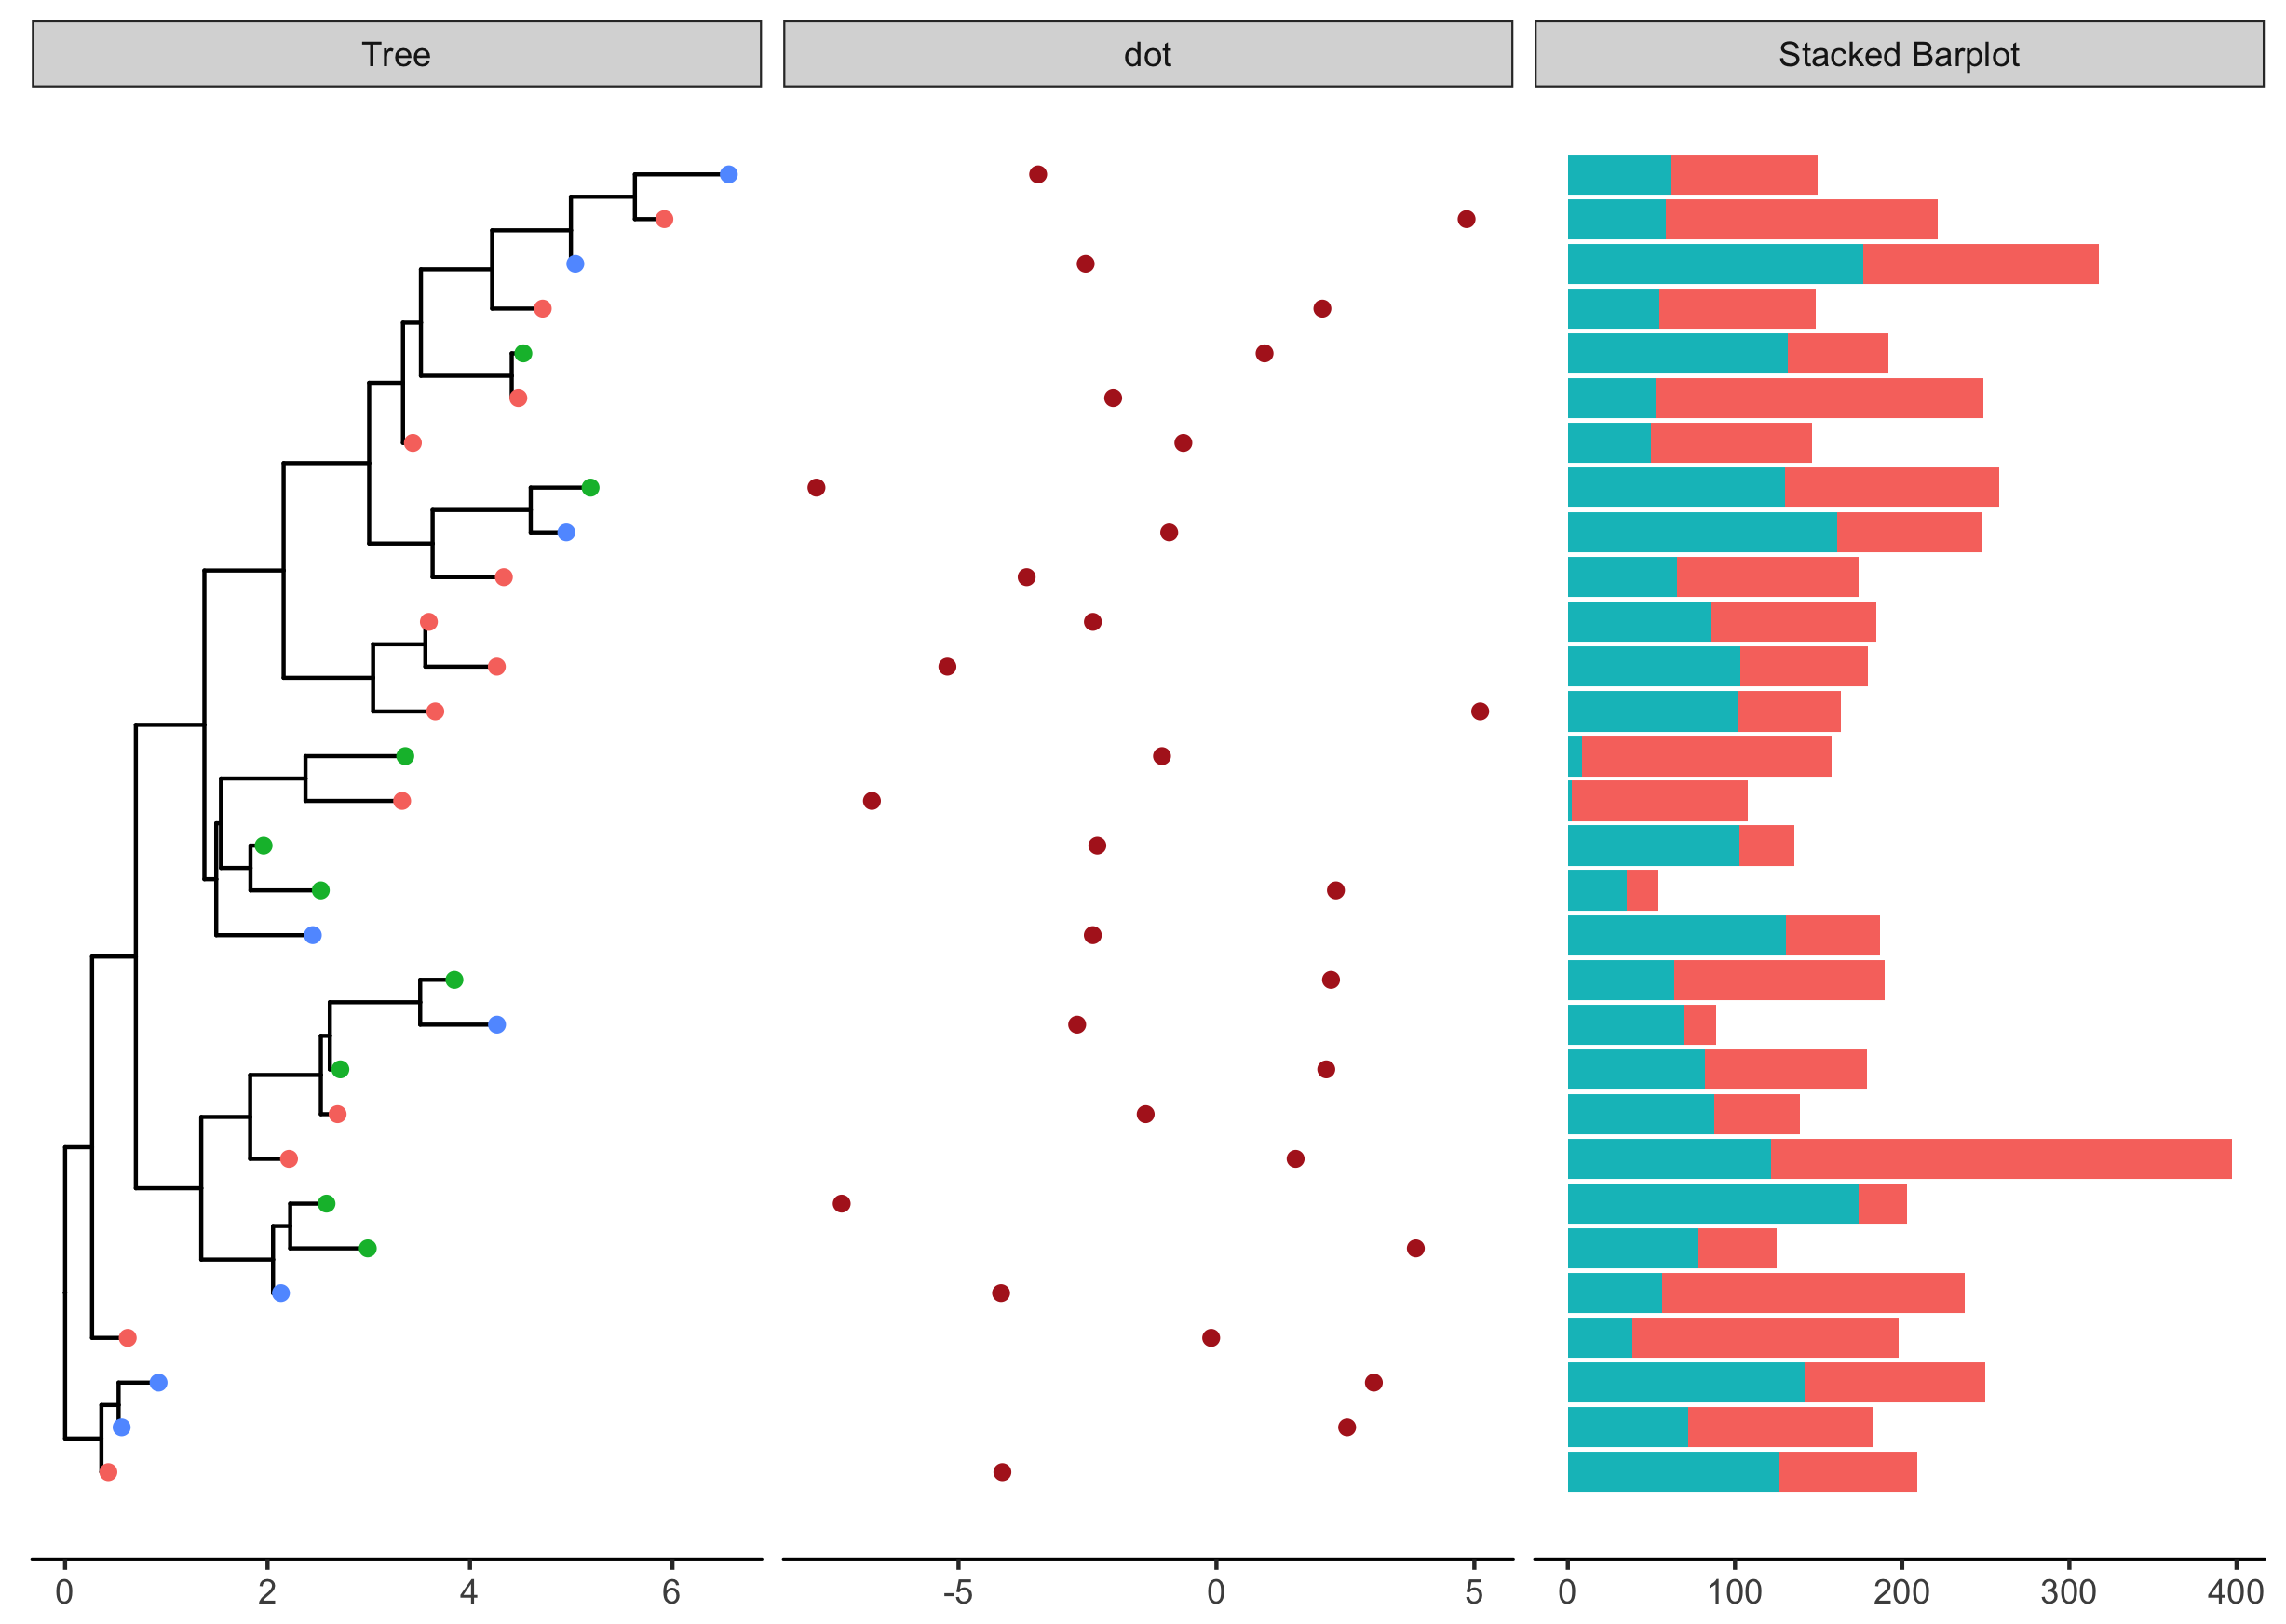
General solution with facet_plot
ggtree provide the facet_plot function which can be used to associate different types of data to the tree. With ggtree we can associate more data (can be different types) and combine them freely.

Citation
G Yu, DK Smith, H Zhu, Y Guan, TTY Lam*. ggtree: an R package for visualization and annotation of phylogenetic trees with their covariates and other associated data. Methods in Ecology and Evolution. doi:10.1111/2041-210X.12628.
