pixel art of ggplot2 faceting using geofacet
I just discovered an interesting ggplot2 extension, geofacet, that supports arranging facet panels that mimics geographic topoloty.
After playing with it, I realized that it is not only for visualizing geo-related data, but also can be fun for presenting data to mimics pixel art.

Here is an example using the Turkey shape:
Turkey <- read.csv("http://pages.iu.edu/~cdesante/turkey.csv")
colnames(Turkey)[2:1] = c("row", "col")
Turkey$row = max(Turkey$row) - Turkey$row +1
Turkey$name <- Turkey$code <- paste0('turkey', 1:nrow(Turkey))
require(ggplot2)
require(geofacet)
x <- split(eu_gdp, eu_gdp$code)
x <- x[sample.int(length(x), nrow(Turkey), replace=T)]
for (i in 1:length(x)) {
x[[i]]$code = Turkey$code[i]
}
y <- do.call(rbind, x)
color = Turkey$Turkey.Colors
names(color) = Turkey$code
y$color = color[y$code]
Turkey = Turkey[, -3]
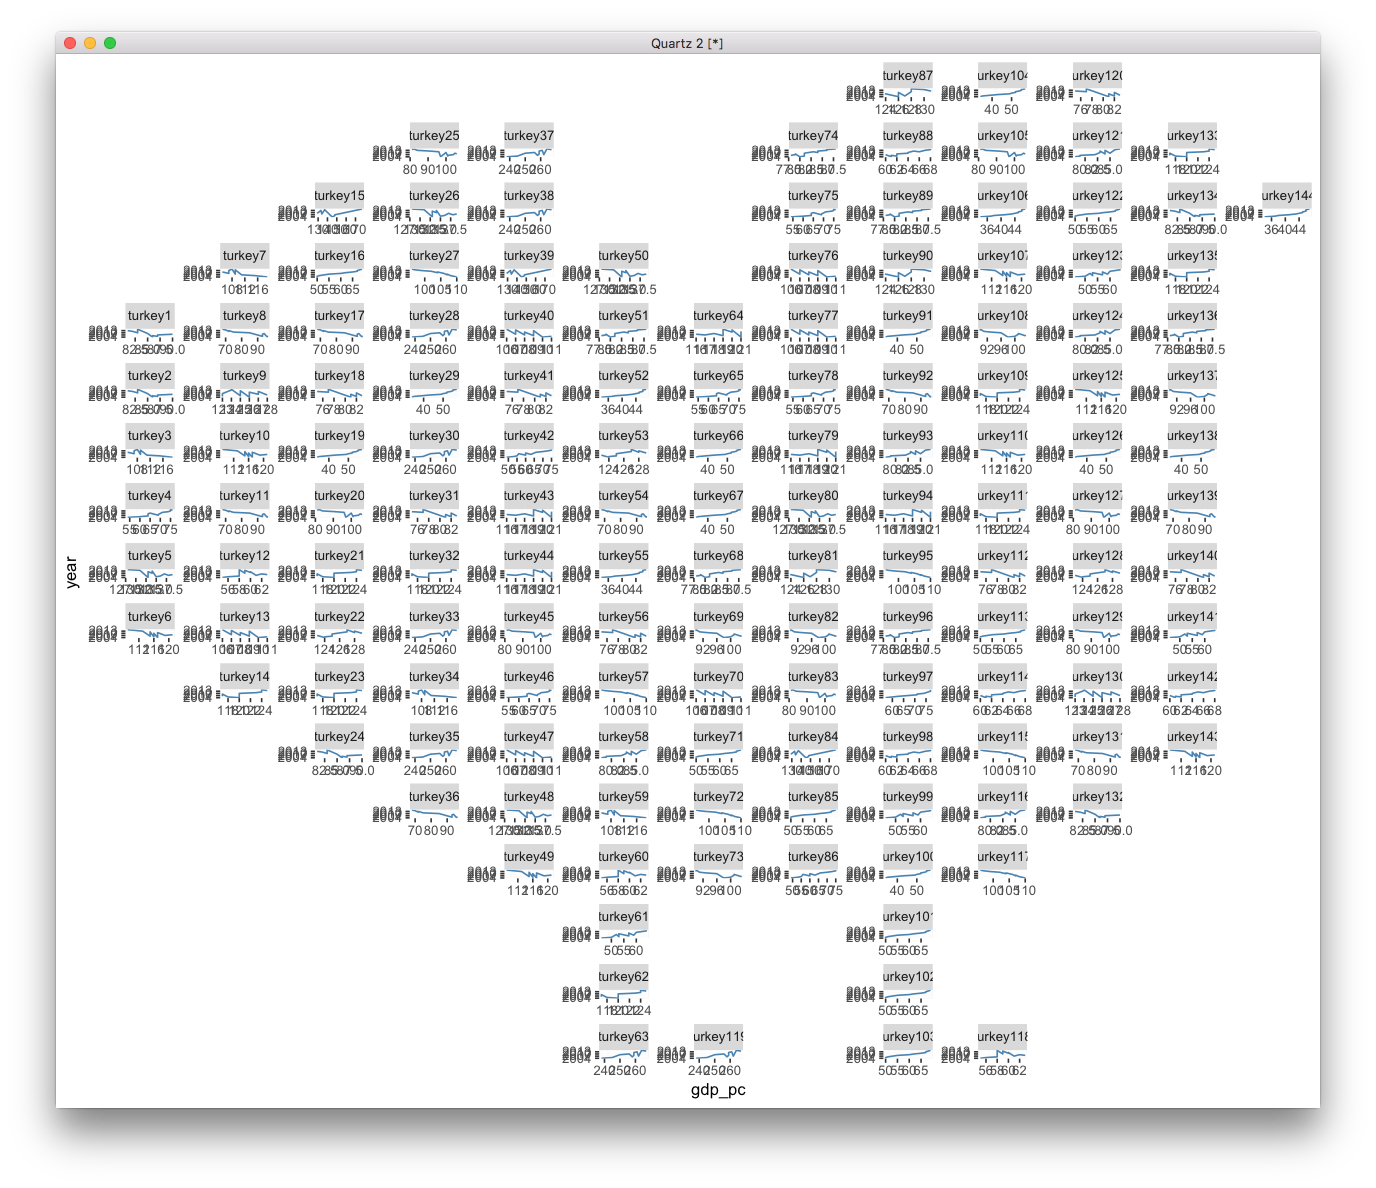
p1 <- ggplot(y, aes(gdp_pc, year))+ geom_line() +
facet_geo(~code, grid=Turkey, scales='free')
print(p1)
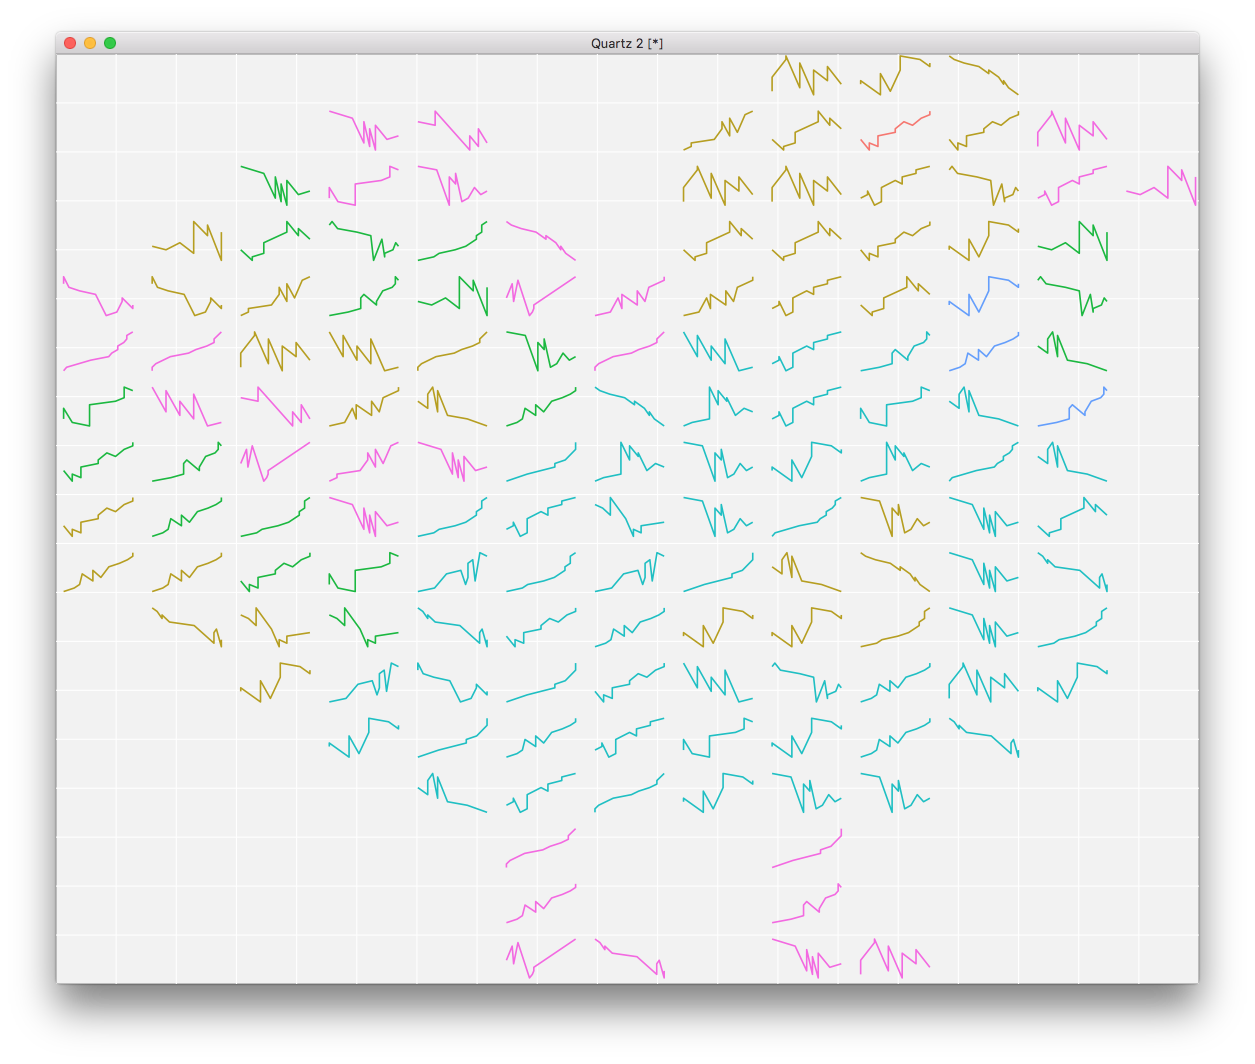
p1 + theme_void() + aes(color=color) + theme(strip.text.x = element_blank(), legend.position='none')