create meme in R
I developed a tiny toy package, meme, which is now on CRAN. As it’s name indicated, it was designed to create memes, which are captioned photos that are intended to be funny, riduculous.
meme()
The package is quite simple. You can use meme() function to add meme captions, and this is all the package supposed to do:
library(meme)
u <- "http://www.happyfamilyneeds.com/wp-content/uploads/2017/08/angry8.jpg"
meme(u, "code", "all the things!")

the grammar :see_no_evil:
The meme package was implemented using grid graphic system. Since grid is the most flexible graphic system in R, I try to mimic ggplot2 (although very superficial) for practice.
User can use mmplot() to read and plot the input image and then using + mm_caption() to add meme captions.
mmplot(u) + mm_caption("calm down", "and RTFM", color="purple")

meme_save()
The meme output can be saved as an object, and can be exported to file using ggsave(). Since we would like to keep the original figure aspect ratio for output meme figure, I provide a helper function, meme_save(), which takes care of the figure aspect ratio and then called ggsave() to export the figure.
u2 <- "http://i0.kym-cdn.com/entries/icons/mobile/000/000/745/success.jpg"
x <- meme(u2, "please", "tell me more")
meme_save(x, file="docs/Figs/meme.png")
the plot method
Users can plot the meme() output and change the caption or other parameters in real time.
plot(x, size = 2, "happy friday!", "wait, sorry, it's monday", color = "firebrick", font = "Courier")

the + method
Instead of using parameters in plot() explictely, Users can use + aes() to set the plot parameters:
x + aes(upper = "#barbarplots",
        lower = "friends don't let friends make bar plots",
        color = firebrick, font = Courier, size=1.5)

or using + list(). The following command will also generate the figure displayed above.
x + list(upper = "#barbarplots",
        lower = "friends don't let friends make bar plots",
        color = "firebrick", font = "Courier", size=1.5)
multi-language support
I didn’t do anything about it. Multi-language was supported internally. Just simply select a font for your language.
y <- meme(u, "卧槽", "听说你想用中文", font="STHeiti")
y

As the meme package was developed using grid, It would be better to provide function to convert the output object to grob. Similar to ggplotGrob() for ggplot object, I provide memeGrob() for the meme object and this making it possible to edit the details of the graph and compatible with the grid ecosystem.
Here are the examples of using meme in grid, ggplot2 and cowplot.
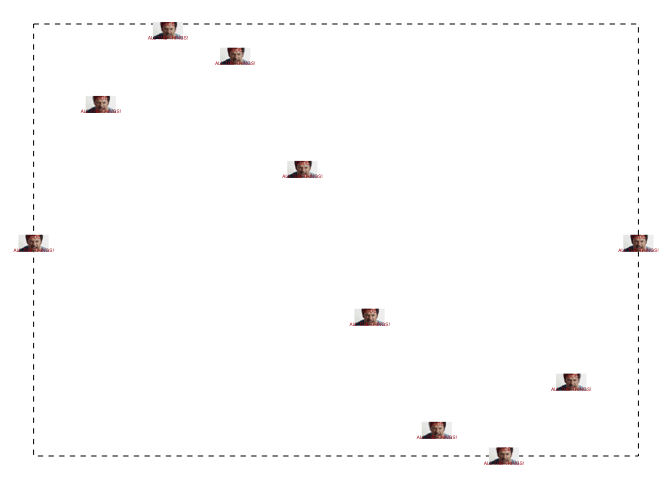
grid support
library(grid)
mm <- meme(u, "code", "all the things!", size=.3, color='firebrick')

grid.newpage()
pushViewport(viewport(width=.9, height=.9))
grid.rect(gp = gpar(lty="dashed"))

xx <- seq(0, 2*pi , length.out=10)
yy <- sin(xx)

for (i in seq_along(xx)) {
    vp <- viewport(x = xx[i]/(2*pi), y = (yy[i]-min(yy))/2, width=.05, height=.05)
    print(mm, vp = vp)
}
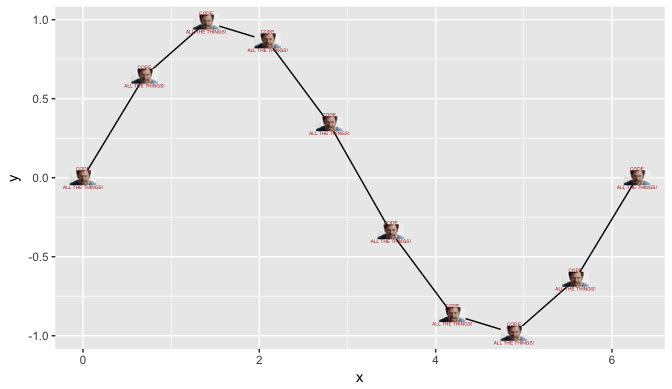
ggplot2 support
library(ggplot2)
library(ggimage)

d <- data.frame(x = xx, y = yy)
ggplot(d, aes(x, y)) + geom_line() +
    geom_subview(mm, x = xx, y = yy, width=.3, height=.15)
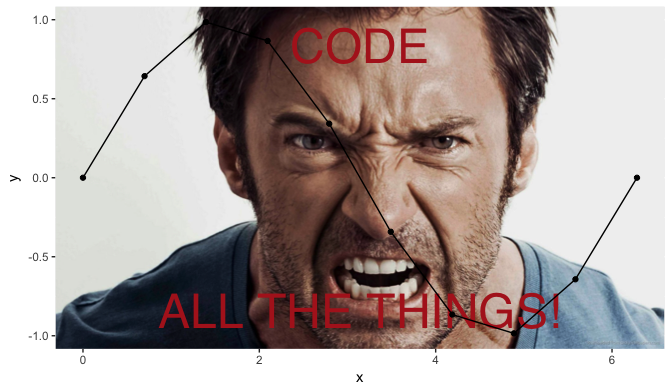
ggplot(d, aes(x, y)) +
    geom_subview(mm+aes(size=3), x=0, y=0, width=Inf, height=Inf) +
    geom_point() + geom_line()
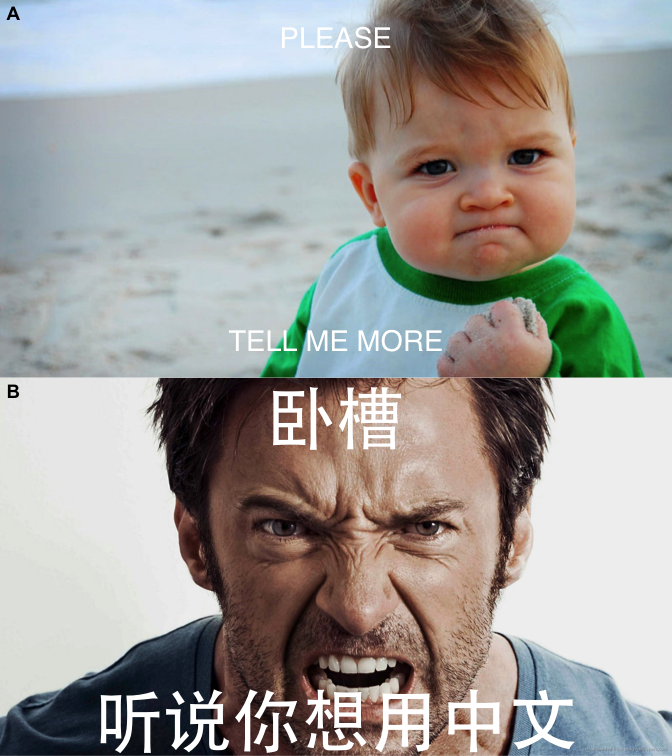
cowplot support
cowplot::plot_grid(x, y, ncol=1, labels = c("A", "B"))