改变outgroup的枝长
Hello all,
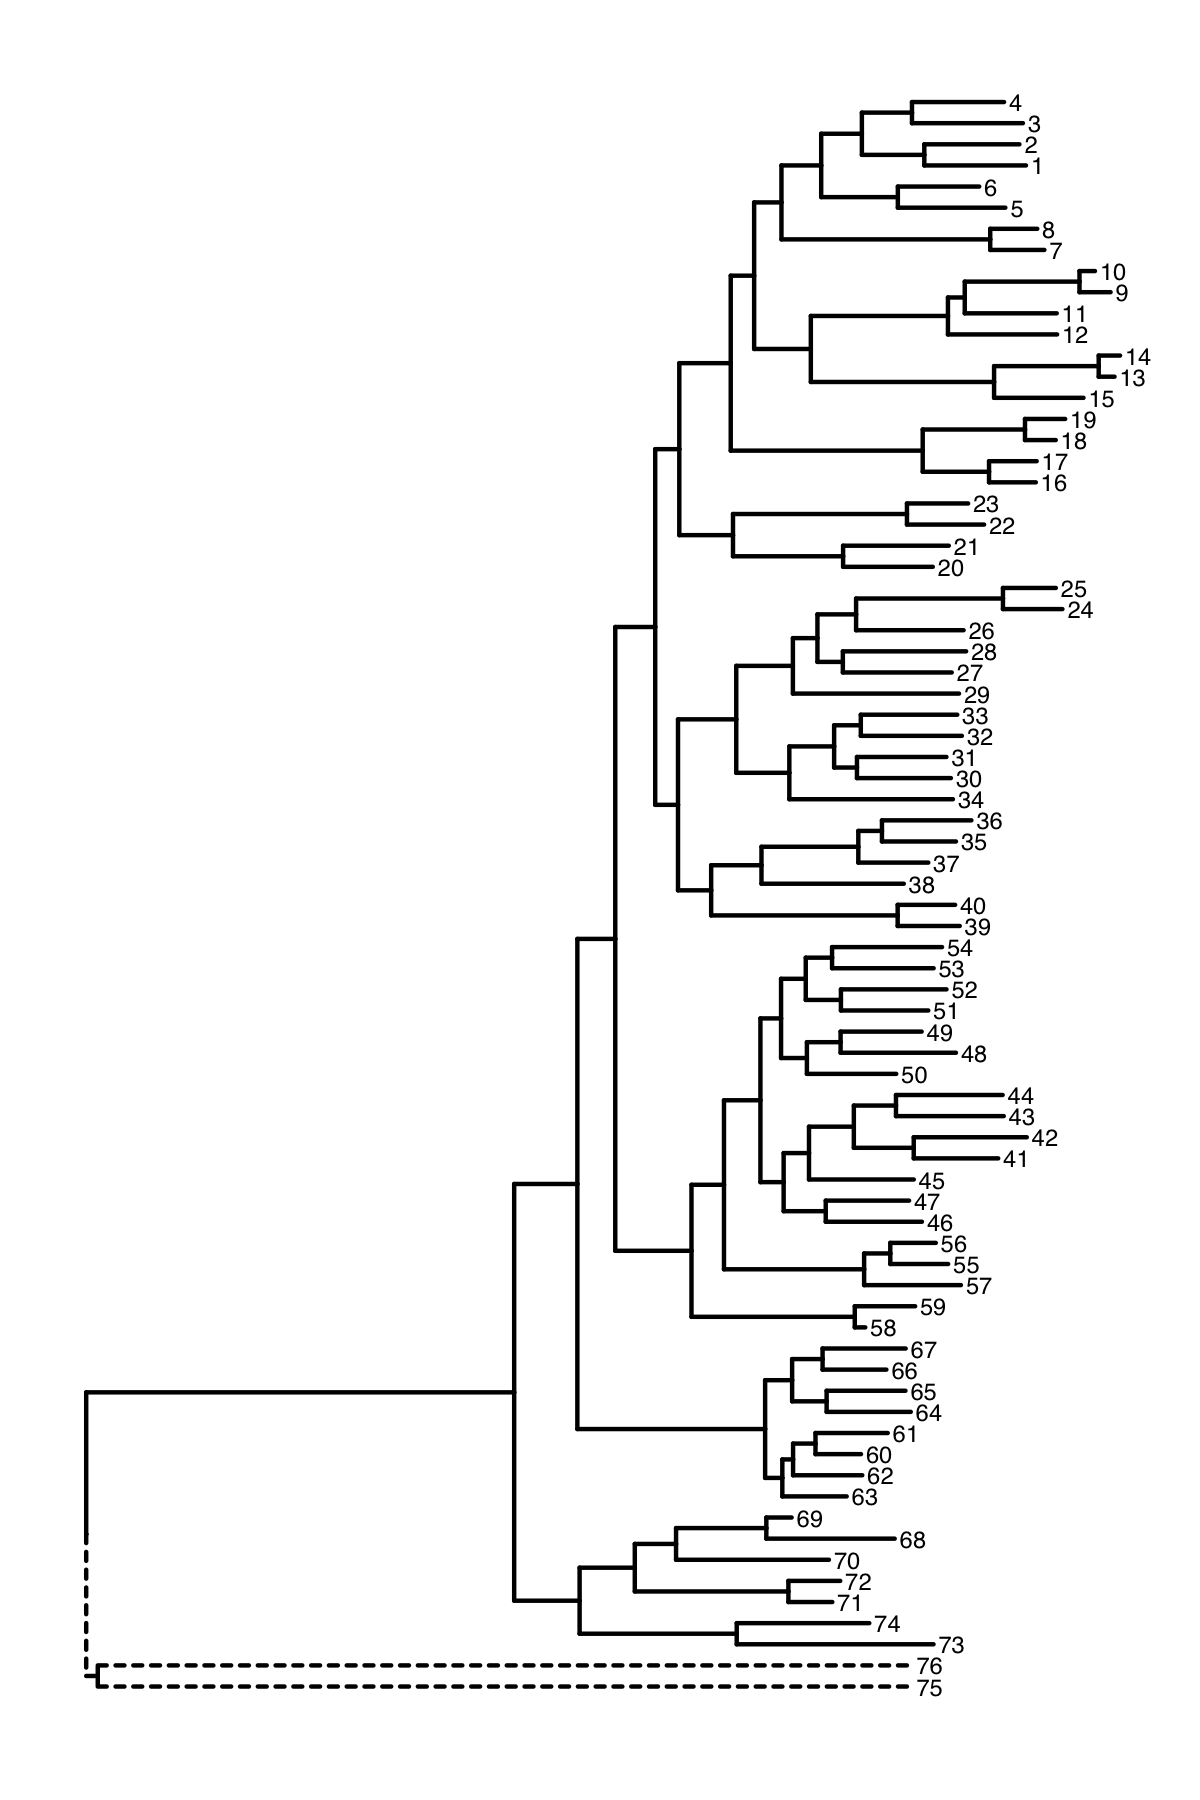
When I plot some data using ggtree, the out groups are on a very long branch length. The out groups are 75 and 76 in the example below.
I would like to keep the out groups in the tree but ignore their branch lengths to make presentation easier.

When I collapse the nodes 75 and 76 it does improve the appearance. but the out groups are still on a long branch.

Is it possible to produce a plot such as the one I created manually below where the branch lengths for the out groups is ignored

The script I have used so far is below and example data attached. Any thoughts would be much appreciated
Cheers Ollie
library(ggtree)

# read in data
x <- read.tree("long-branch-example.newick")

# create ggtree object
tree <- ggtree(x) + geom_tiplab(size = 2)

# plot tree
tree

# find node for outgroup
MRCA(x, tip =c("75", "76"))

# collapse outgroup node
tree <- collapse(tree, node = 151)

# plot resulting tree
tree
这是google group里的问题,要跟进问题,或者是下载提问者的文件做为练习的话,请移步https://groups.google.com/forum/?utm_medium=email&utm_source=footer#!msg/bioc-ggtree/T2ySvqv351g/MagXaWHBCwAJ.
这个问题还是挺简单的,他已经读了树x,并且知道outgroup是75和76,以及outgroup的同共祖先节点151,那么首先我们可以用groupClade把151这个clade给标记起来,然后用映射linetype,这样就可以用虚线来表示outgroup,再者可以人为改75和76的坐标。
library(ggtree)
x <- read.tree("long-branch-example.newick")
groupClade(x, 151) -> y
ggtree(y, aes(linetype=group)) + geom_tiplab(size = 2) -> p
p$data[p$data$node %in% c(75, 76), "x"] = mean(p$data$x)
print(p)