separating legends of heatmaps in ggtree
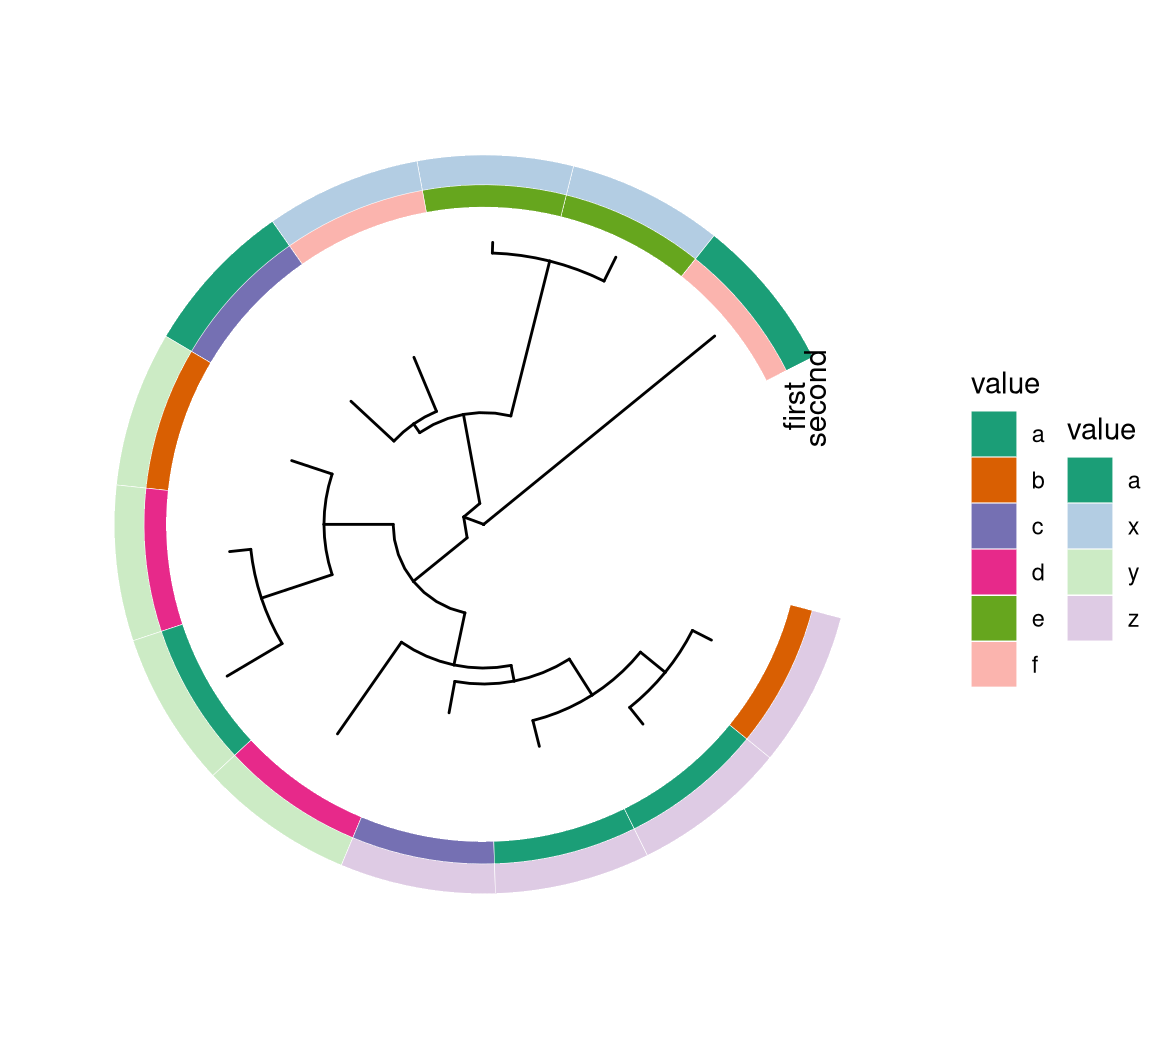
Applying different color palettes is also easy using scale_fill_manual to manually specify color to fill the heatmaps. However, the legends of different heatmaps (different rings here) are mixed together.
require(RColorBrewer)
col <- c(brewer.pal(5, "Dark2"), brewer.pal(4, "Pastel1"))
names(col) = c(letters[1:6], letters[24:26])

pp <- p2 + scale_fill_manual(values=col)
print(pp)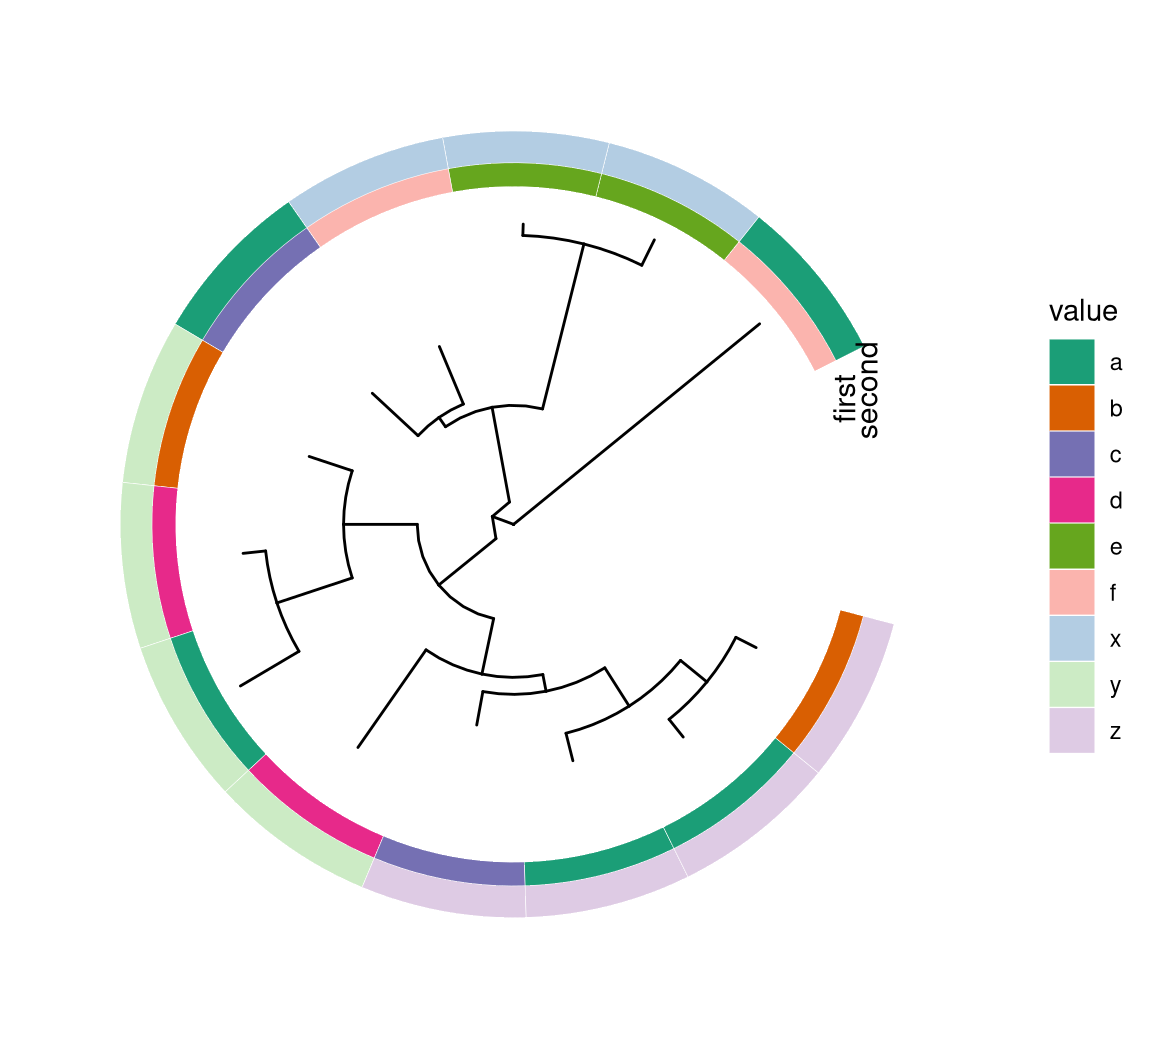
It is possible/tricky to separate them, by overriding aes. Here I introduce a solution that is easy to understand and follow. We can plot the tree with each individual heatmap and extract each of the legend. Then we can use cowplot to combine our tree (without legend) and all the separated legends.
p1x <- p1 + scale_fill_manual(values=col)
p2x <- gheatmap(circ, df[, "second", drop=F], offset=5, width=.1) +
    scale_fill_manual(values=col)

require(cowplot)
leg1 <- get_legend(p1x)
leg2 <- get_legend(p2x)

pp <- pp + theme(legend.position="none")
plot_grid(pp, leg1, leg2, ncol=3, rel_widths=c(1, .1, .1))