让我们画个黑板报吧
上次推送的《geom_bgimage》,竟然有人问说用ggplot2怎么搞。明明我的例子就是了,虽然用的是ggtree的例子,但与ggplot2何异?
require(ggplot2)
require(ggimage)
d = data.frame(x=LETTERS[1:3], y = 1:3)
d$y2 = rev(cumsum(rev(d$y)))
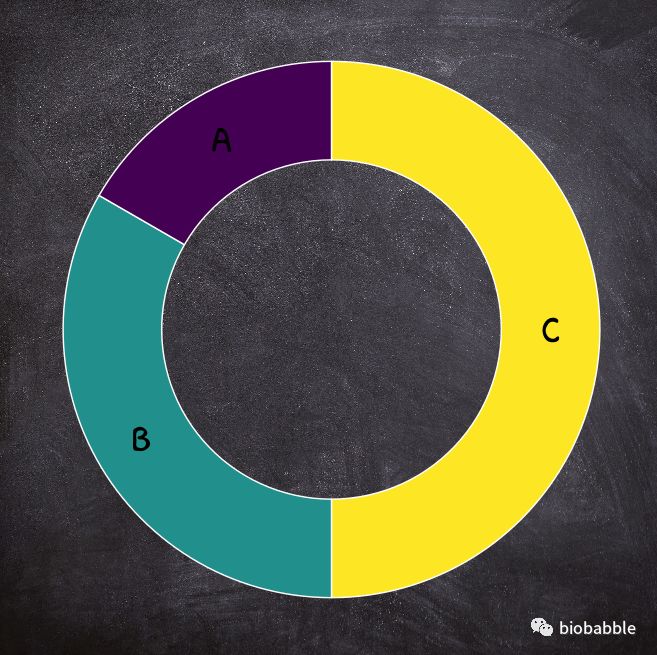
p = ggplot(d, aes(x=1, y, fill=x)) + geom_col(color='white') +
geom_bgimage("img/blackboard.jpg") + theme_void() +
coord_polar("y") + theme(legend.position='none') +
geom_text(aes(y = y2 - y/2, label=x),family='xkcd', size=8) +
xlim(-1, NA) + scale_fill_viridis_d()
画出来是这样子的:
require(xkcd)
dataman <- data.frame( x= -1, y=0,
                  scale = 2,
                  ratioxy = 1,
                  angleofspine =  -pi/2 ,
                  anglerighthumerus = -pi/6,
                  anglelefthumerus = pi + pi/6,
                  anglerightradius = 0,
                  angleleftradius = pi/4,
                  angleleftleg = 3*pi/2  + pi / 12 ,
                  anglerightleg = 3*pi/2  - pi / 12,
                  angleofneck = 3 * pi / 2 + pi/10,
                  color = 'a'
                  )

mapping <- aes(x=x,
               y=y,
               scale=scale,
               ratioxy=ratioxy,
               angleofspine = angleofspine,
               anglerighthumerus = anglerighthumerus,
               anglelefthumerus = anglelefthumerus,
               anglerightradius = anglerightradius,
               angleleftradius = angleleftradius,
               anglerightleg =  anglerightleg,
               angleleftleg = angleleftleg,
               angleofneck = angleofneck,
               color = color)

g = ggplot() + xkcdman(mapping,dataman) + theme_void() + theme(legend.position="none")
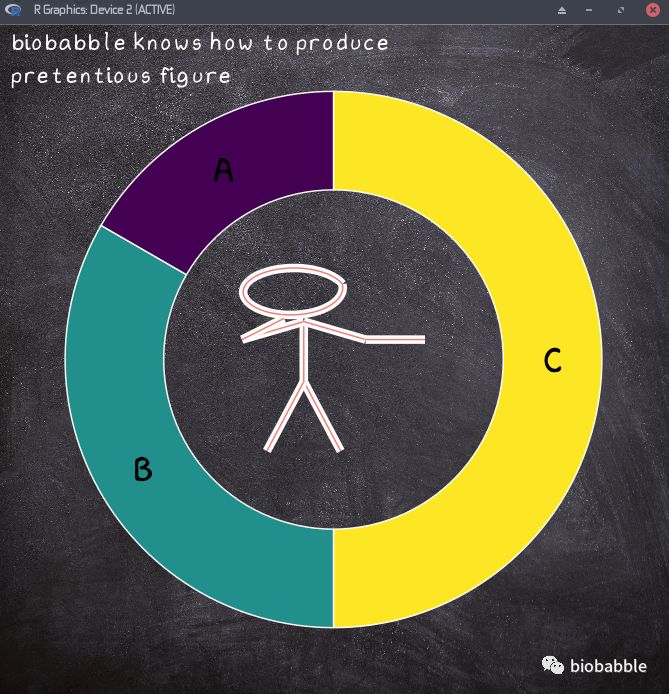
上面的例子画的是个小人,让我们拼在一起吧:
require(ggplotify)
as.ggplot(p) + geom_subview(subview=g, x=.5, y=.5, width=.3, height=.3) +
    annotate("text", x = .02, y=.95,
             label="biobabble knows how to produce\npretentious figure",
             family='xkcd', size=6, color='white', hjust=0)