clusterProfiler.dplyr:用dplyr操作富集分析结果
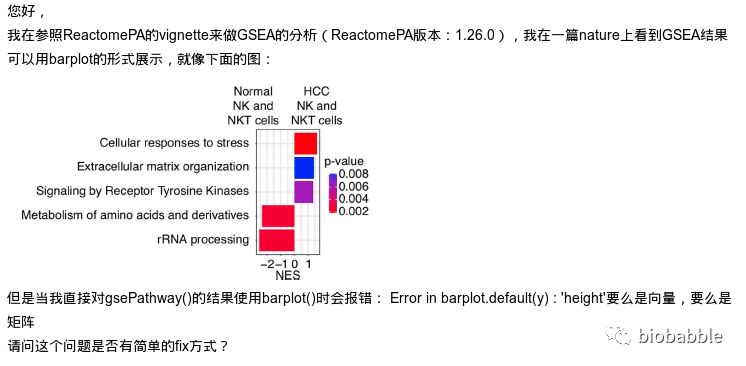
出错的原因在于,我根本就没给GSEA分析的结果写barplot方法,所以默认去调用graphics::barplot.default了,于是出错。
但这样的图,对于我们来说,简直简单的不要不要的。
首先跑一下GSEA的分析, 这里用ReactomePA来跑一下通路的GSEA分析:
library(ReactomePA)
data(geneList)
x <- gsePathway(geneList)
结果中有308个通路是显著性的。

> x
#
# Gene Set Enrichment Analysis
#
#...@organism      human
#...@setType      Reactome
#...@keytype      ENTREZID
#...@geneList      Named num [1:12495] 4.57 4.51 4.42 4.14 3.88 ...
 - attr(*, "names")= chr [1:12495] "4312" "8318" "10874" "55143" ...
#...nPerm      10000
#...pvalues adjusted by 'BH' with cutoff <0.05
#...308 enriched terms found
'data.frame':    308 obs. of  11 variables:
 $ ID             : chr  "R-HSA-1474244" "R-HSA-216083" "R-HSA-3000178" "R-HSA-3000171" ...
 $ Description    : chr  "Extracellular matrix organization" "Integrin cell surface interactions" "ECM proteoglycans" "Non-integrin membrane-ECM interactions" ...
 $ setSize        : int  266 80 74 56 53 41 38 36 35 33 ...
 $ enrichmentScore: num  -0.458 -0.512 -0.626 -0.586 -0.592 ...
 $ NES            : num  -1.94 -1.86 -2.24 -1.99 -1.99 ...
 $ pvalue         : num  0.000133 0.000152 0.000154 0.000158 0.000159 ...
 $ p.adjust       : num  0.00295 0.00295 0.00295 0.00295 0.00295 ...
 $ qvalues        : num  0.00215 0.00215 0.00215 0.00215 0.00215 ...
 $ rank           : num  1943 1890 1890 2538 1890 ...
 $ leading_edge   : chr  "tags=33%, list=16%, signal=29%" "tags=39%, list=15%, signal=33%" "tags=46%, list=15%, signal=39%" "tags=45%, list=20%, signal=36%" ...
 $ core_enrichment: chr  "8038/11132/4017/1288/4811/3910/3371/1291/3791/831/1301/4238/7450/3685/80781/1280/1306/4314/3675/8425/977/4054/7"| __truncated__ "3371/1291/3791/7450/3685/80781/1280/3675/1278/4060/1277/1293/1295/58494/1281/83700/50509/1290/3693/1294/3339/12"| __truncated__ "3910/3371/1291/3685/1280/7042/3912/1278/4060/1277/1293/1281/50509/1290/3693/3339/1462/1289/1292/3908/3909/6678/"| __truncated__ "3915/6385/4921/1288/3910/3371/1301/3685/1280/3912/1278/1277/2247/1281/50509/1290/3693/3339/1289/3908/3909/3913/1300/1287" ...
#...Citation
  Guangchuang Yu, Qing-Yu He. ReactomePA: an R/Bioconductor package for
  reactome pathway analysis and visualization. Molecular BioSystems
  2016, 12(2):477-479
clusterProfiler.dplyr神器
用这个包,你可以对输出像data frame一样使用dplyr的函数去操作。
于是这里使用arrange去给NES的绝对值从大到小排序,NES是我们用于计算p值的统计量,正数越大则通路越有可能是激活的,而负数越小则通路越有可能是被抑制的,所以我们也经常看到使用这一统计量进行画图。
然后我们使用group_by把数据分组了,按照NES正负数来分,最后我们把每一组切出来前5个。也就是说分别取激活或抑制最大的5个通路。
library(clusterProfiler.dplyr)
y <- arrange(x, abs(NES)) %>%
        group_by(sign(NES)) %>%
        slice(1:5)
最后如我们所愿,取出10个通路。
> y
#
# Gene Set Enrichment Analysis
#
#...@organism      human
#...@setType      Reactome
#...@keytype      ENTREZID
#...@geneList      Named num [1:12495] 4.57 4.51 4.42 4.14 3.88 ...
 - attr(*, "names")= chr [1:12495] "4312" "8318" "10874" "55143" ...
#...nPerm      10000
#...pvalues adjusted by 'BH' with cutoff <0.05
#...10 enriched terms found
Classes ‘grouped_df’, ‘tbl_df’, ‘tbl’ and 'data.frame':    10 obs. of  12 variables:
 $ ID             : chr  "R-HSA-397014" "R-HSA-8978868" "R-HSA-9006934" "R-HSA-211859" ...
 $ Description    : chr  "Muscle contraction" "Fatty acid metabolism" "Signaling by Receptor Tyrosine Kinases" "Biological oxidations" ...
 $ setSize        : int  183 141 418 165 117 308 282 169 162 155
 $ enrichmentScore: num  -0.357 -0.37 -0.338 -0.373 -0.402 ...
 $ NES            : num  -1.45 -1.46 -1.49 -1.5 -1.54 ...
 $ pvalue         : num  0.004193 0.006929 0.000503 0.001696 0.003381 ...
 $ p.adjust       : num  0.0216 0.03289 0.00381 0.01039 0.01827 ...
 $ qvalues        : num  0.01572 0.02394 0.00277 0.00756 0.0133 ...
 $ rank           : num  2990 1951 2788 2129 2829 ...
 $ leading_edge   : chr  "tags=34%, list=24%, signal=26%" "tags=26%, list=16%, signal=22%" "tags=27%, list=22%, signal=21%" "tags=25%, list=17%, signal=21%" ...
 $ core_enrichment: chr  "59/9992/800/6543/4638/3750/2982/11280/3709/2977/6546/3672/7169/6335/783/10174/4604/6588/7139/27091/3784/1760/72"| __truncated__ "5563/284541/37/224/3248/1543/79966/2181/8644/5095/27306/80724/11001/33/6785/7923/6584/57834/1384/2166/60481/831"| __truncated__ "26052/534/2065/3709/7423/1215/2263/83464/26469/7057/4670/7072/1298/3915/5921/5441/200734/9846/9611/3315/466/111"| __truncated__ "4837/6799/1553/8459/284541/7366/8648/1543/2098/29104/1548/54996/27306/196/2232/2954/57834/6817/22977/1581/7358/"| __truncated__ ...
 $ sign(NES)      : num  -1 -1 -1 -1 -1 1 1 1 1 1
 - attr(*, "groups")=Classes ‘tbl_df’, ‘tbl’ and 'data.frame':    2 obs. of  2 variables:
  ..$ sign(NES): num  -1 1
  ..$ .rows    :List of 2
  .. ..$ : int  1 2 3 4 5
  .. ..$ : int  6 7 8 9 10
  ..- attr(*, ".drop")= logi FALSE
#...Citation
  Guangchuang Yu, Qing-Yu He. ReactomePA: an R/Bioconductor package for
  reactome pathway analysis and visualization. Molecular BioSystems
  2016, 12(2):477-479
画图
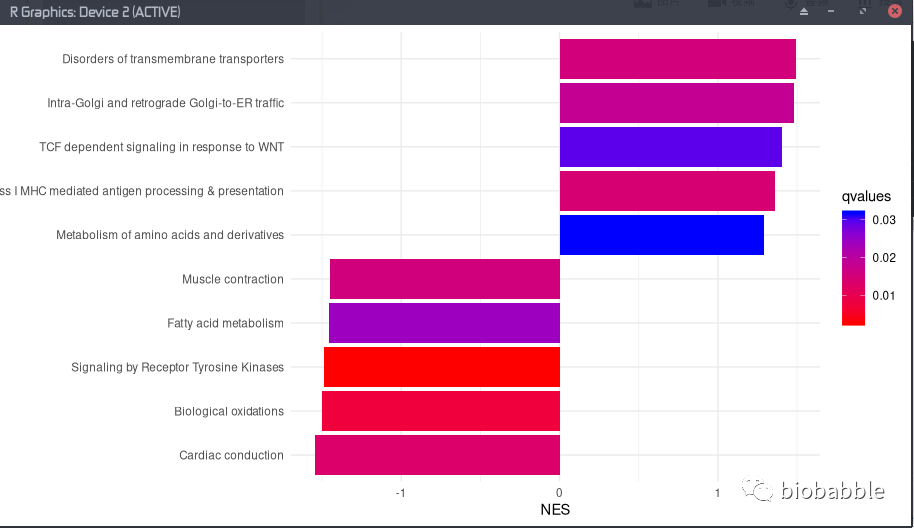
然后你直接就可以对上面这样的对象使用ggplot进行画图,你没看错,你不需要转为data frame,而是直接对这个S4对象进行ggplot,魔法就在enrichplot包。然后一切都是ggplot语法了。
library(forcats)
library(ggplot2)
library(ggstance)
library(enrichplot)

ggplot(y, aes(NES, fct_reorder(Description, NES), fill=qvalues), showCategory=10) +
    geom_barh(stat='identity') +
    scale_fill_continuous(low='red', high='blue') +
    theme_minimal() + ylab(NULL)