
multiple annotation in ChIPseeker
Nearest gene annotation
Almost all annotation software calculate the distance of a peak to the nearest TSS and assign the peak to that gene. This can be misleading, as binding sites might be located between two start sites of different genes or hit different genes which have the same TSS location in the genome.
The function annotatePeak provides option to assign genes with a max distance cutoff and all genes within this distance were reported for each peak.
> anno = annotatePeak(getSampleFiles()[[4]], addFlankGeneInfo=TRUE, flankDistance=5000)
>> loading peak file...              2014-09-30 01:12:09 PM
>> preparing features information...         2014-09-30 01:12:09 PM
>> identifying nearest features...       2014-09-30 01:12:10 PM
>> calculating distance from peak to TSS...  2014-09-30 01:12:11 PM
>> assigning genomic annotation...       2014-09-30 01:12:11 PM
>> adding flank feature information from peaks...2014-09-30 01:12:37 PM
>> assigning chromosome lengths          2014-09-30 01:12:39 PM
>> done...                   2014-09-30 01:12:39 PM
> head(as.GRanges(anno))
GRanges object with 6 ranges and 14 metadata columns:
      seqnames             ranges strand |          V4        V5
                      |
  [1]     chr1 [ 815092,  817883]      * | MACS_peak_1    295.76
  [2]     chr1 [1243287, 1244338]      * | MACS_peak_2     63.19
  [3]     chr1 [2979976, 2981228]      * | MACS_peak_3    100.16
  [4]     chr1 [3566181, 3567876]      * | MACS_peak_4    558.89
  [5]     chr1 [3816545, 3818111]      * | MACS_peak_5     57.57
  [6]     chr1 [6304864, 6305704]      * | MACS_peak_6     54.57
             annotation  geneChr geneStart   geneEnd geneLength geneStrand

  [1] Distal Intergenic     chr1    803451    812182       8732          -
  [2]  Promoter (<=1kb)     chr1   1243994   1247057       3064          +
  [3]  Promoter (<=1kb)     chr1   2976181   2980350       4170          -
  [4]  Promoter (<=1kb)     chr1   3547331   3566671      19341          -
  [5]  Promoter (<=1kb)     chr1   3816968   3832011      15044          +
  [6]  Promoter (1-2kb)     chr1   6304252   6305638       1387          +
           geneId transcriptId distanceToTSS

  [1]      284593   uc001abt.4         -5701
  [2]      126789   uc001aed.3             0
  [3]      440556   uc001aka.3             0
  [4]       49856   uc001ako.3             0
  [5]   100133612   uc001alg.3             0
  [6]      390992   uc009vly.2          1452
                                                                                                                                                               flank_txIds

  [1]                                                                                                                                                           uc001abt.4
  [2] uc001aea.2;uc001aeb.2;uc001aec.1;uc001aed.3;uc010nyi.2;uc009vjx.3;uc009vjy.1;uc001aee.2;uc001aef.2;uc001aeg.2;uc001aeh.2;uc001aei.2;uc001aek.2;uc009vjz.2;uc010nyj.2
  [3]                                                                                                    uc001aka.3;uc010nzg.1;uc001akc.3;uc001ake.3;uc001akf.3;uc009vlh.3
  [4]                                                                   uc001ako.3;uc001akn.3;uc010nzi.2;uc001akp.3;uc021ofb.1;uc021ofc.1;uc021ofd.1;uc021ofe.1;uc021off.1
  [5]                                                                                                    uc001alg.3;uc010nzo.2;uc001alh.4;uc001alf.3;uc009vls.3;uc031pkz.1
  [6]                                                                                                                                                uc001amp.2;uc009vly.2
                                                                                        flank_geneIds

  [1]                                                                                          284593
  [2] 116983;116983;116983;126789;126789;126789;54973;54973;54973;54973;54973;54973;54973;54973;54973
  [3]                                                           440556;440556;63976;63976;63976;63976
  [4]                                                 49856;49856;49856;7161;7161;7161;7161;7161;7161
  [5]                                              100133612;100133612;100133612;339448;339448;339448
  [6]                                                                                   387509;390992
                                                           flank_gene_distances

  [1]                                                                     -2910
  [2] -1978;-18;0;0;0;-128;8492;15729;15729;15729;15729;15729;15729;15729;15729
  [3]                                               0;0;-4514;-4514;-4514;-4514
  [4]                                 0;0;0;-1253;-1253;-1253;-1253;-1253;-1253
  [5]                                                               0;0;0;0;0;0
  [6]                                                                   15331;0
  -------
  seqinfo: 24 sequences from hg19 genome
Three extra columns, flank_txIds, flank_geneIds, flank_gene_distances were added if parameter addFlankGeneInfo is set to TRUE.
Genomic annotation
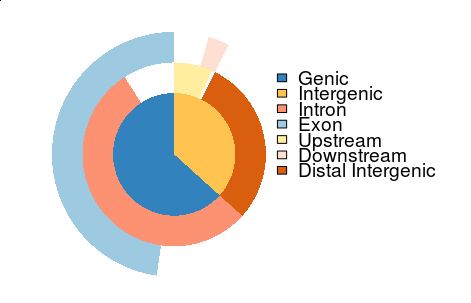
The annotation column annotates the genomic location of a given peak. Since some annotations overlap, they are assigned based on the following priority.
- Promoter (defined by tssRegion parameter)
- 5' UTR
- 3' UTR
- Exon
- Intron
- Downstream (immediate downstream of a gene, within 3kb)
- Distal Intergenic
I have implemented plotAnnoPie and plotAnnoBar to visualize their distribution. I am wondering how to visualize the annotation overlap and found venn pie-agram can partially solve this issue. It’s hard/impossible to visualize all the overlap information within one vennpie plot.
I employed the vennpie to ChIPseeker, and now with the vennpie function, we can visualize some of the overlap annotations.
vennpie(anno)
In order to manage complex data, annotatePeak now output a S4 object. Users can use as.GRanges to convert it to as.GRanges object or as.data.frame to convert it to data.frame and then the output can be exported by write.table function.
Citation
Yu G, Wang LG and He QY*. ChIPseeker: an R/Bioconductor package for ChIP peak annotation, comparison and visualization. Bioinformatics 2015, 31(14):2382-2383.
