
ggtree for outbreak data
OutbreakTools implements basic tools for the analysis of Disease Outbreaks.
It defines S4 class obkData to store case-base outbreak data. It also provides a function, plotggphy, to visualize such data on the phylogenetic tree.
library(OutbreakTools)
data(FluH1N1pdm2009)
attach(FluH1N1pdm2009)
x <- new("obkData", individuals = individuals, dna = FluH1N1pdm2009$dna,
dna.individualID = samples$individualID, dna.date = samples$date,
trees = FluH1N1pdm2009$trees)
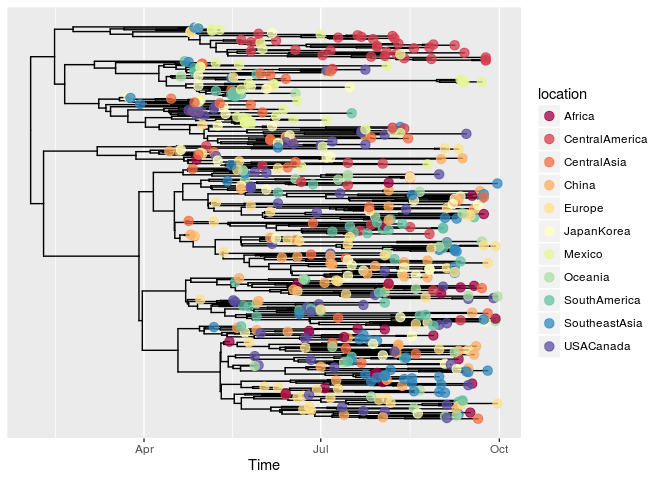
plotggphy(x, ladderize = TRUE, branch.unit = "year",
tip.color = "location", tip.size = 3, tip.alpha = 0.75)
As I mentioned in the post, ggtree for microbiome data, ggtree fits the R ecosystem in phylogenetic analysis. It serves as a general tools for annotating phylogenetic tree with different associated data from various sources. obkData object is also supported by ggtree and outbreak data stored in the object can be used to annotate the tree using grammar of graphics supported by ggtree.
library(ggtree)
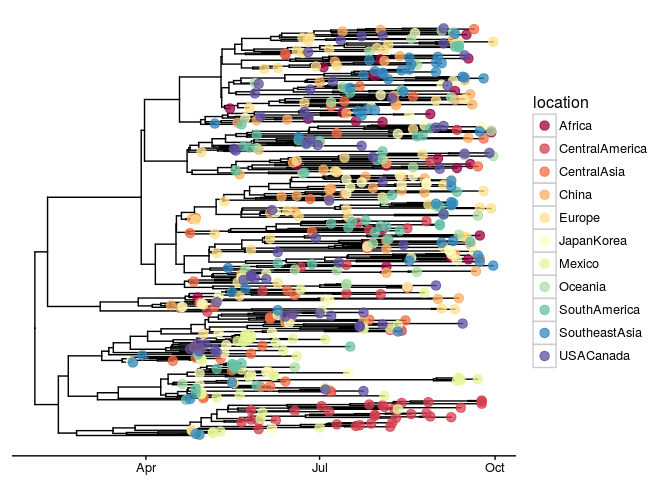
ggtree(x, mrsd="2009-09-30", as.Date=TRUE) +
geom_tippoint(aes(color=location), size=3, alpha=.75) +
scale_color_brewer("location", palette="Spectral") +
theme_tree2(legend.position='right')
We can also associate the tree with other type of data that may come from experiments or evolution inference and use them to annotate the tree as demonstrated in the online vignettes.
Citation
G Yu, DK Smith, H Zhu, Y Guan, TTY Lam*. ggtree: an R package for visualization and annotation of phylogenetic trees with their covariates and other associated data. Methods in Ecology and Evolution. doi:10.1111/2041-210X.12628.
