
viewing and annotating phylogenetic tree with ggtree
When I need to annotate nucleotide substitutions in the phylogenetic tree, I found that all the software are designed to display the tree but not annotating it. Some of them may support annotating the tree with specific data such as bootstrap values, but they are restricted to a few supported data types. It is hard/impossible to inject user specific data.
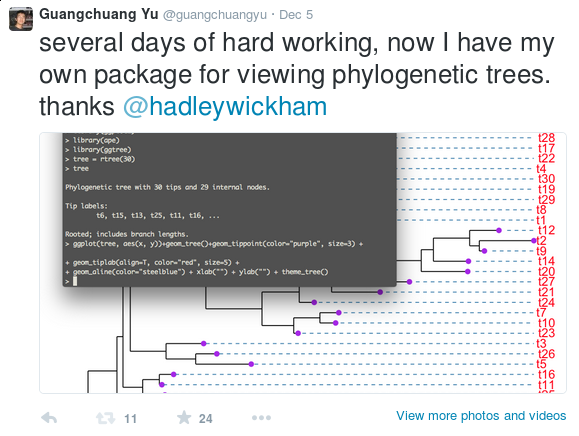
I decided to implement my own one by extending the ggplot2 package. There are other R packages that implemented tree viewer using ggplot2, including OutbreakTools, phyloseq and ggphylo, but all of them only create complex tree view function for their specific needs. They are just classical tree viewers that only viewing the tree or annotating a specific data type. The good parts of ggplot2 are not available in these packages. They lack of flexibilities of annotating phylogenetic tree by diverse user inputs. I develop ggtree, which is based on grammar of graphics and will takes all the good parts of ggplot2.
nwk <- system.file("extdata", "sample.nwk", package = "ggtree")
library(ape)
tree <- read.tree(nwk)
library(ggplot2)
library(ggtree)
ggplot(tree, aes(x, y)) + geom_tree() + theme_tree() + xlab("") + ylab("")
It extends ggplot2 to support tree objects and implements a geom_tree() layer to draw the tree.
The ggtree package provides a function, ggtree, for shortcut of
ggplot()+geom_tree()+theme_tree().
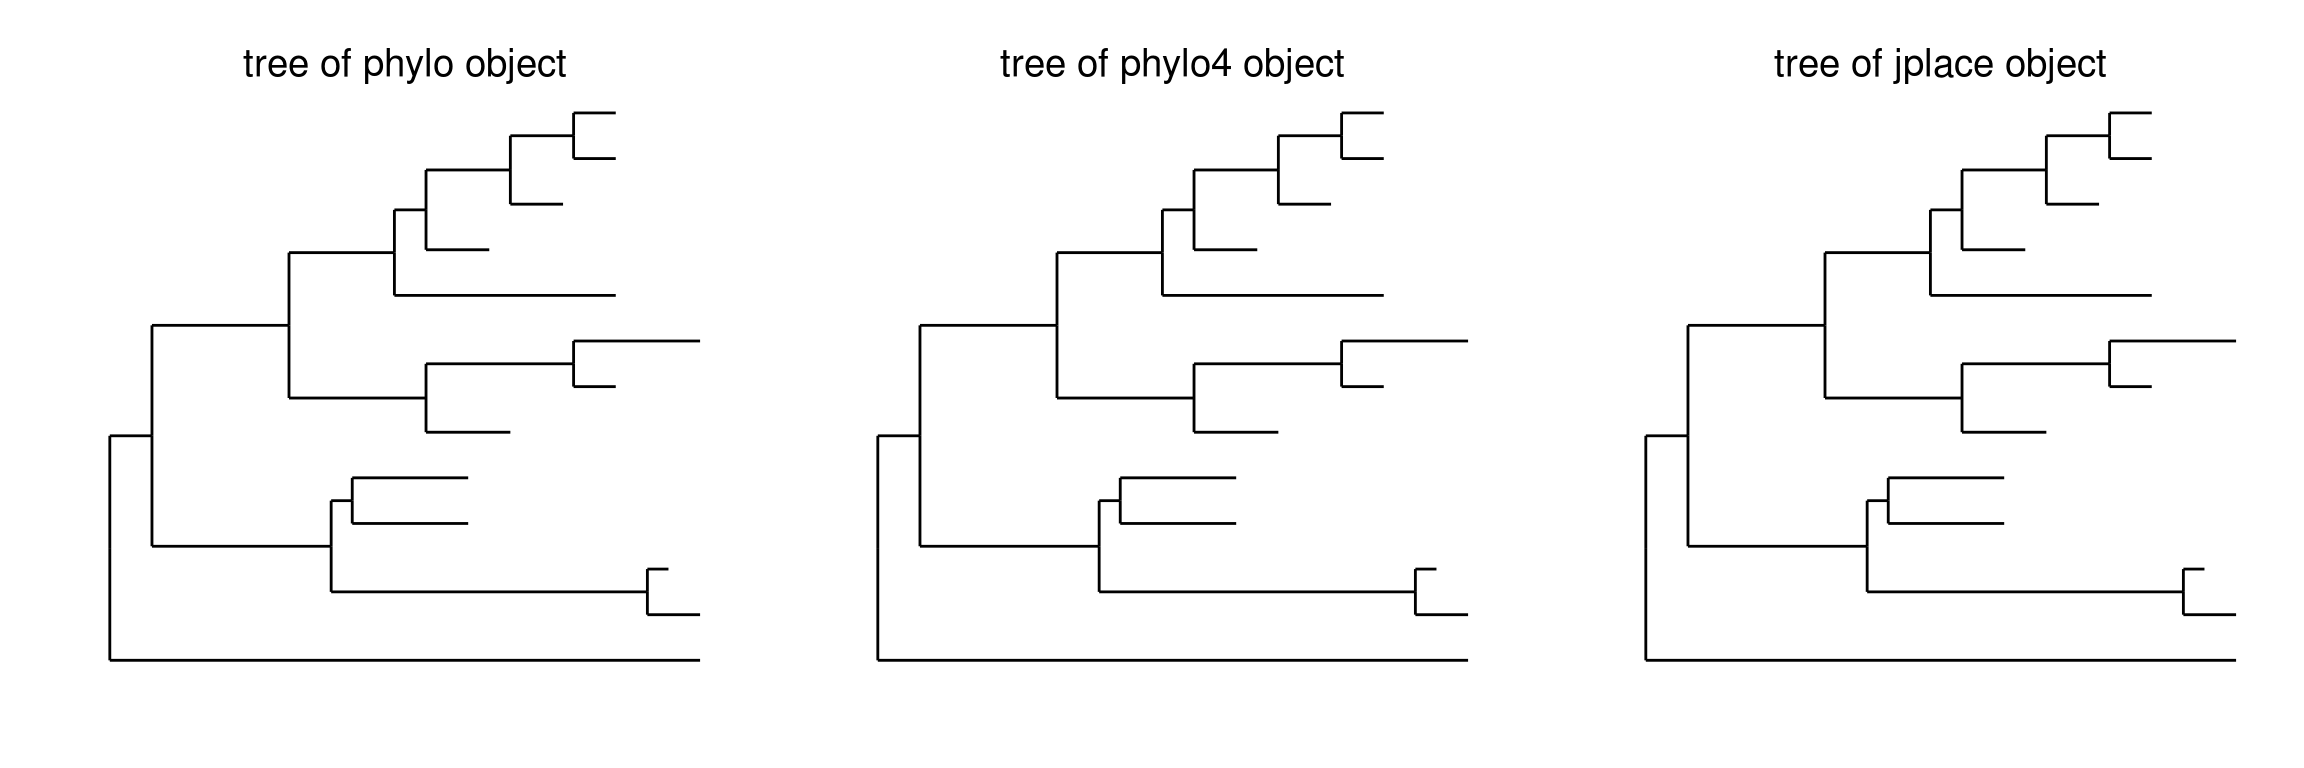
It supports several tree objects including phylo that defined in ape, phylo4 that defined in phylobase and jplace that defined within the ggtree package.
p1 <- ggtree(tree) + ggtitle("tree of phylo object")
tr2 <- as(tree, "phylo4")
p2 <- ggtree(tr2) + ggtitle("tree of phylo4 object")
jpf <- system.file("extdata", "sample.jplace", package="ggtree")
jp <- read.jplace(jpf)
p3 <- ggtree(jp) + ggtitle("tree of jplace object")
library(gridExtra)
grid.arrange(p1, p2, p3, ncol=3)
With this implementation, it is possible to inject user input. But is it
easy? The answer is yes and no. It may depends on user’s ggplot2
experiences. To place the input data at the correct position, you should
know how the tree was layout. It may be easy for an experienced user,
but hard for newbie. Most of us are impatient and reluctant to learn, so
I should create a way that is easy to follow. It’s not a good idea to
implement unnecessary geom_XXX layer, for it violates the great idea of
taking all the good parts of ggplot2, and it will violate the consistent
function calls of geom_XXX. Thanks to my sleep disorder, I came out
with an operator %<+% for injecting input data to the tree view.
After the injection, the data is visible to all the geom_XXX layers.
p <- ggtree(tree)

print(dd)
taxa    place   value
M   NA  55.9
A   GZ  65.6
C   GZ  59.3
I   CZ  78.5
E   GZ  62.9
D   GZ  64.1
J   CZ  62.3
K   CZ  79.1
B   GZ  89.0
L   CZ  57.1
G   HK  66.4
H   HK  61.6
F   HK  59.9
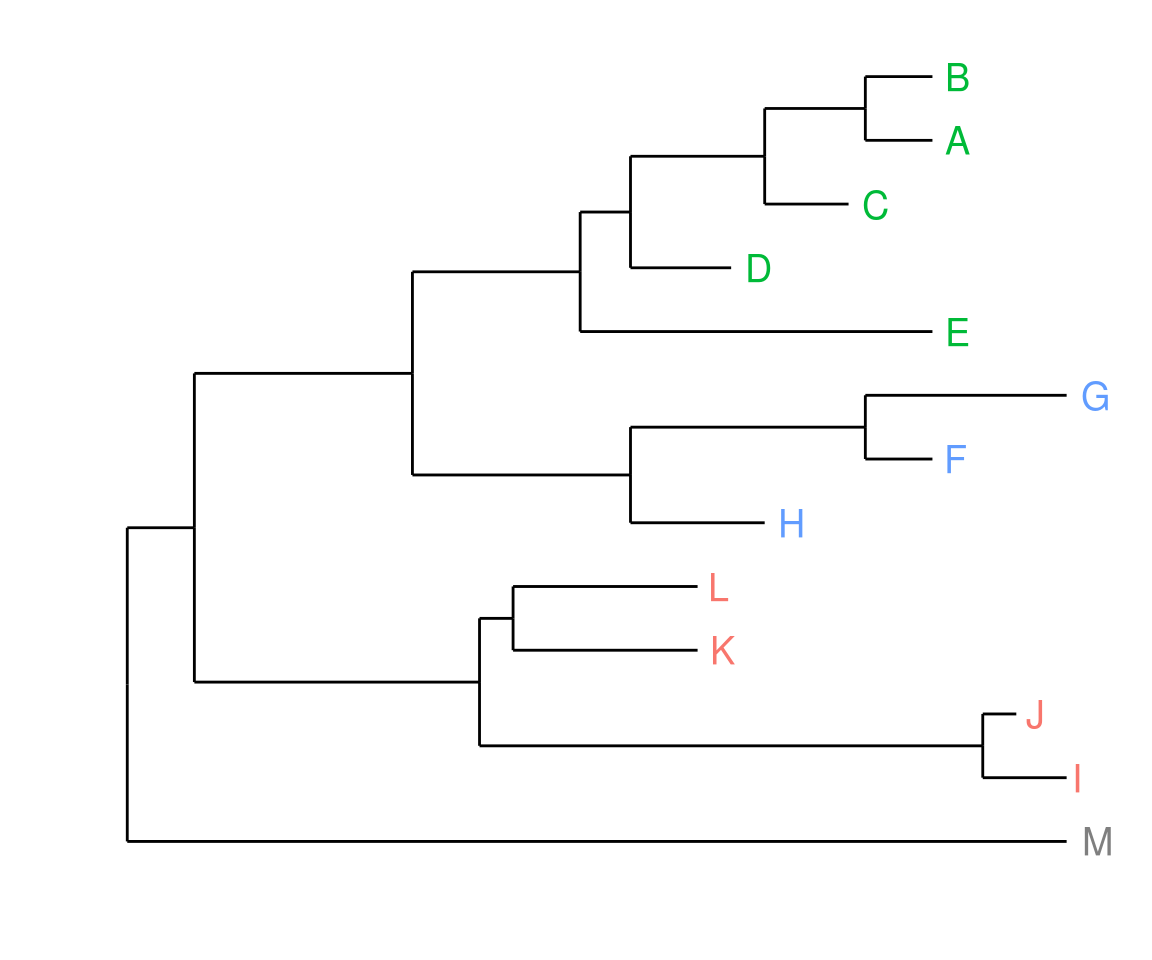
Suppose we have a tree view p, and input data dd, we can attach the data to the tree and add a layer of tip labels and colored by place.
p <- p %<+% dd + geom_text(aes(color=place, label=label), hjust=-0.5)
print(p)
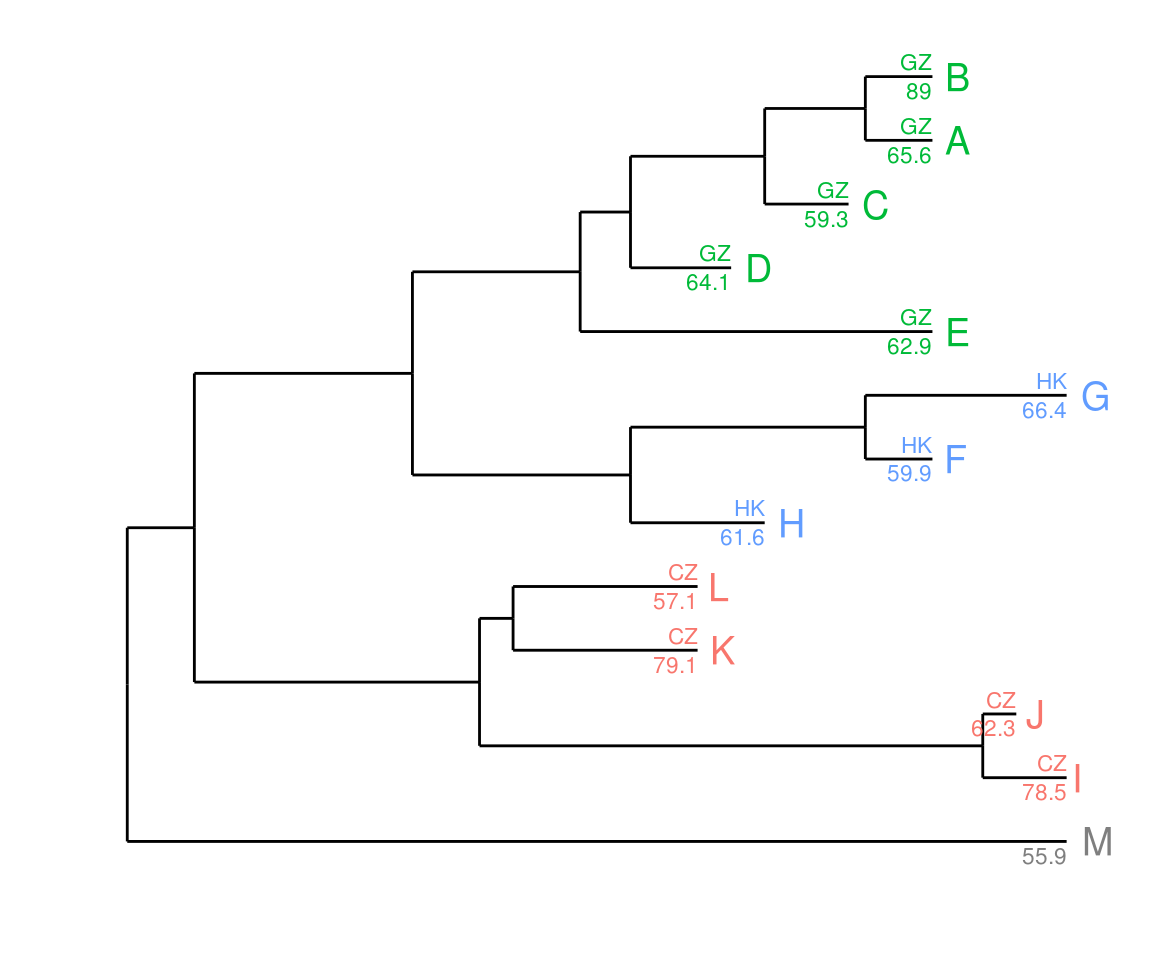
Once the data is attached, it is always attached, and we can add more layers easily.
p + geom_text(aes(color=place, label=place), hjust=1, vjust=-0.4, size=3) +
  geom_text(aes(color=place, label=value), hjust=1, vjust=1.4, size=3)
The package is now available via github, https://github.com/GuangchuangYu/ggtree.
Suggestions, comments and feature request are all welcome. Let’s make it an easy to use and feature-riched package for viewing and annotating phylogenetic trees.
At last, wish you a merry christmas :)
Citation
G Yu, DK Smith, H Zhu, Y Guan, TTY Lam*. ggtree: an R package for visualization and annotation of phylogenetic trees with their covariates and other associated data. Methods in Ecology and Evolution. doi:10.1111/2041-210X.12628.
