I don’t know whether ‘rename taxa’ is a common task or not. It seems not a good idea to rename taxa in Newick tree text, since it may introduce problems when mapping the original sequence alignment to the tree.

If you just want to show different or additional information when plotting the tree, it is fine and easy to do it using ggtree:

Continue reading

I am trying to add a scale to an unrooted tree with geom_treescale, but when I use it, the tree completely collapses and I am not able to set anything that fix it. Anybody has any idea on how to do it ?

google group里的问题,说他加geom_treescale之后,树被压缩了,由于他没有给出可重复性的例子,所以我们并不知道情况到底有多么糟糕,但这种情况是可能发生的,因为加treescale这种东西,默认情况下geom_treescale会自己去计算该加多大的scale bar,该放在什么位置上,而这种默认情况是基于rectangular布局来的,在假设的情况下,都不可能尽善尽美,假设不成立的情况下当然有可能搞得很差。

Continue reading

据说1024是程序员的节日,就在这一天,Y叔开始了第一次的网络讲座,首次在网络上露面。内容就是上一周预告的《线上沙龙》。

很多人想要学ggplot2 + ggtree,但我的定位不是技术性的培训,而是学术讲座,所以一开始把问题摆出来,是有一些问题存在,有knowledge gap,然后我要去解决它。当然考虑到听众的knowledge gap也很大,我在介绍ggtree的之前,也帮大众撸了一篇R的画图,在这简短的时间里,你应该了解了R几个画图系统的关系,base和grid我在slides里写graphic system,但lattice和ggplot2我写的是data visualization system,我对它们是有区别对待的,像lattice和ggplot2自己是不成一体的,但提供了高阶的数据可视化方法/语法。听完讲座你也应该了解ggplot2,知道要怎样去入门,知道重点该学什么。

Continue reading

This is a question from ggtree google group:

Dear ggtree team,

how can I apply a geom_xxx to only one facet panel? For example if i want to get geom_hline(yintersect=1:30) or a geom_text() in the dot panel? I cant see the facet_grid(. ~ var) function call, so I don’t know which subsetting to use. I have already read http://stackoverflow.com/questions/29873155/geom-text-and-facets-not-working

  tr <- rtree(30)
  
  d1 <- data.frame(id=tr$tip.label, val=rnorm(30, sd=3))
  p <- ggtree(tr)
  
  p2 <- facet_plot(p, panel="dot", data=d1, geom=geom_point, aes(x=val), color='firebrick')
  d2 <- data.frame(id=tr$tip.label, value = abs(rnorm(30, mean=100, sd=50)))
  
  p3 <- facet_plot(p2, panel='bar', data=d2, geom=geom_segment, aes(x=0, xend=value, y=y, yend=y), size=3, color='steelblue') + theme_tree2()

Thanks! Andreas

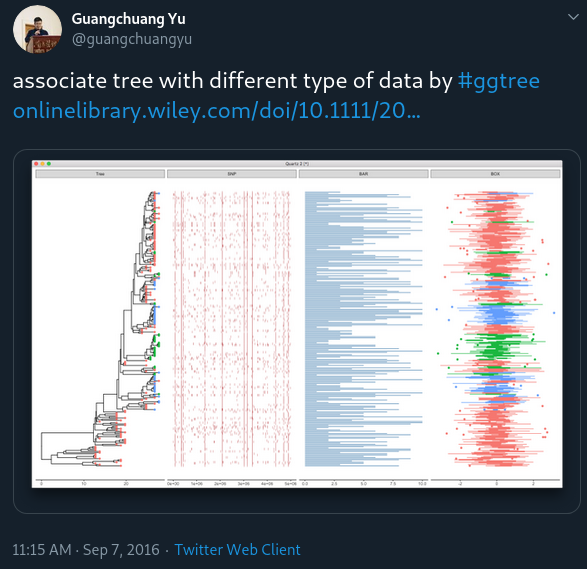
If this can be done, we can create even more comprehensive tree plots.

Continue reading

A ggtree user recently asked me the following question in google group:

I try to plot long tip labels in ggtree and usually adjust them using xlim(), however when creating a facet_plot xlim affects all plots and minimizes them.

Is it possible to work around this and only affect the tree and it’s tip labels leaving the other plots in facet_plot unaffected?

This is indeed a desire feature, as ggplot2 can’t automatically adjust xlim for text since the units are in two different spaces (data and pixel).

Continue reading

ggtree provides gheatmap for visualizing heatmap and msaplot for visualizing multiple sequence alignment with phylogenetic tree.

We may have different data types and want to visualize and align them with the tree. For example, dotplot of SNP site (e.g. using geom_point(shape='|')), barplot of trait values (e.g. using geom_barh(stat='identity')) et al.

To make it easy to associate different types of data with phylogenetic tree, I implemented the facet_plot function which accepts a geom function to draw the input data.frame and display it in an additional panel.

Continue reading

本文受魏太云(@cloud_wei)的邀请,最初在2015年发表于统计之都

进化树看起来和层次聚类很像。有必要解释一下两者的一些区别。

层次聚类的侧重点在于分类,把距离近的聚在一起。而进化树的构建可以说也是一个聚类过程,但侧重点在于推测进化关系和进化距离(evolutionary distance)。

层次聚类的输入是距离,比如euclidean或manhattan距离。把距离近的聚在一起。而进化树推断是从生物序列(DNA或氨基酸)的比对开始。最简单的方法是计算一下序列中不匹配的数目,称之为hamming distance(通常用序列长度做归一化),使用距离当然也可以应用层次聚类的方法。进化树的构建最简单的方法是非加权配对平均法(Unweighted Pair Group Method with Arithmetic Mean, UPGMA),这其实是使用average linkage的层次聚类。这种方法在进化树推断上现在基本没人用。更为常用的是邻接法(neighbor joining),两个节点距离其它节点都比较远,而这两个节点又比较近,它们就是neighbor,可以看出neighbor不一定是距离最近的两个节点。真正做进化的人,这个方法也基本不用。现在主流的方法是最大似然法(Maximum likelihood, ML),通过进化模型(evolutionary model)估计拓朴结构和分支长度,估计的结果具有最高的概率能够产生观测数据(多序列比对)。另外还有最大简约法和贝叶斯推断等方法用于构建进化树。

Continue reading

Author's picture

Guangchuang Yu

Bioinformatics Professor @ SMU

Bioinformatics Professor

Guangzhou