
an example of drawing beast tree using ggtree
FigTree is designed for viewing
beast output as demonstrated by their example data:
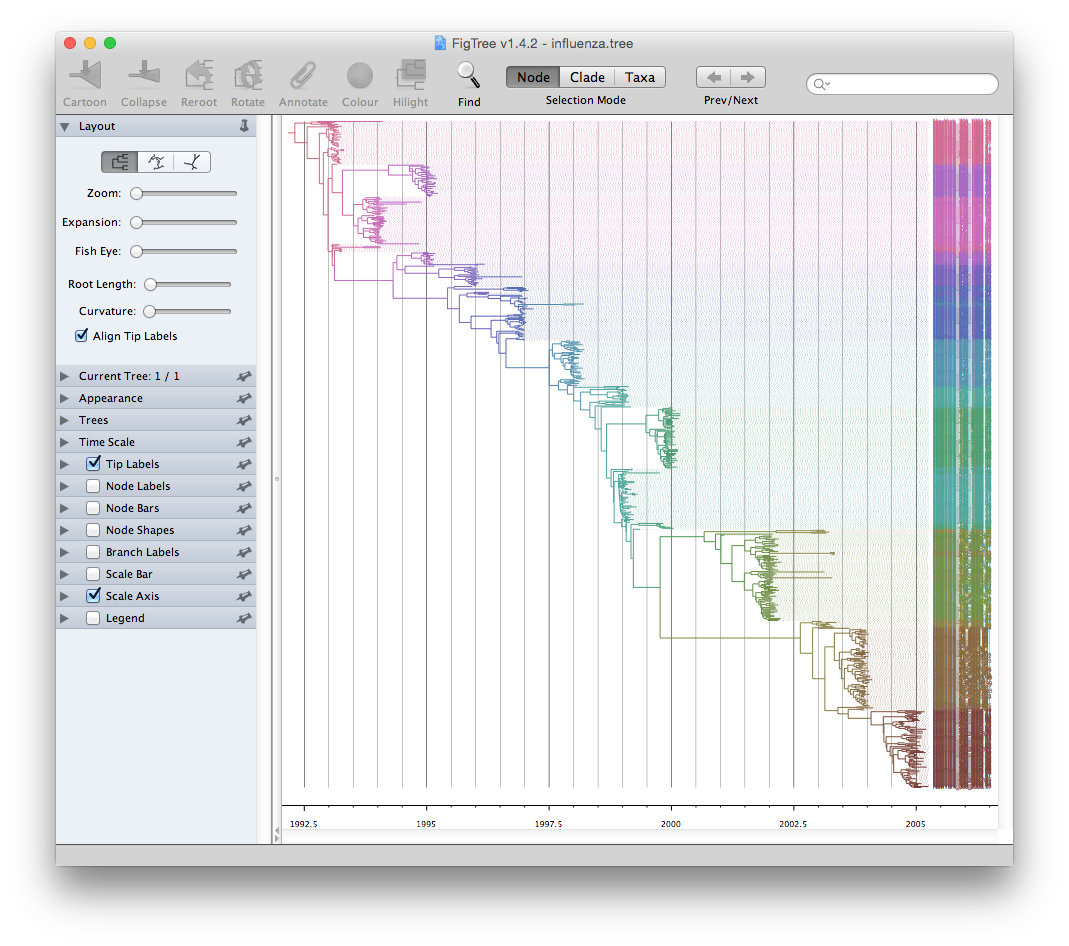
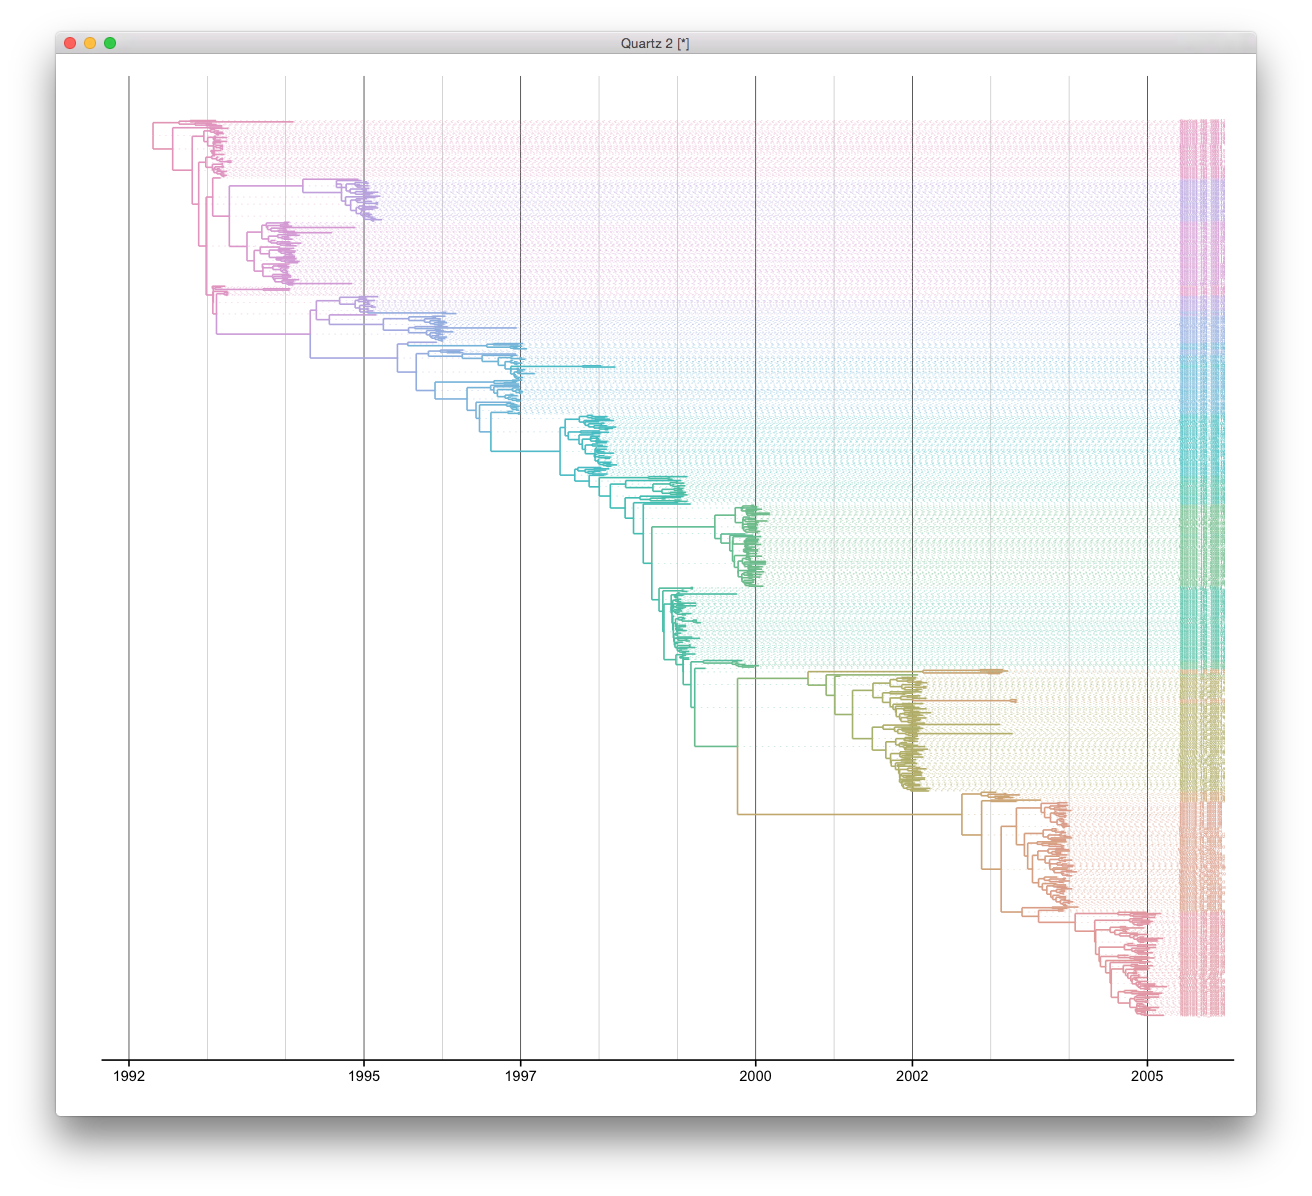
BEAST output is well supported by ggtree and it’s easy to reproduce such a tree view. ggtree supports parsing beast output by read.beast function. We can visualize the tree directly by using ggtree function. Since this is a time scale tree, we can set the parameter mrsd to most recent sampling date.
require(ggplot2)
require(ggtree)
x <- read.beast("/Applications/FigTree/influenza.tree")
cols <- scale_color(x, by="height")
ggtree(x, right=TRUE, mrsd="2005-04-02", color=cols) + theme_tree2() +
    geom_text(aes(x=max(x), label=label), size=1, color=cols, hjust=-.3) +
        scale_x_continuous(breaks=c(1992, 1995, 1997, 2000, 2002, 2005), minor_breaks=seq(1992, 2005, 1)) +
            geom_segment(aes(xend=max(x)+.20, yend=y), linetype="dotted", size=.1, color=cols) +
                theme(panel.grid.major   = element_line(color="black", size=.2),
                      panel.grid.minor   = element_line(color="grey", size=.2),
                      panel.grid.major.y = element_blank(),
                      panel.grid.minor.y = element_blank())
Citation
G Yu, DK Smith, H Zhu, Y Guan, TTY Lam*. ggtree: an R package for visualization and annotation of phylogenetic trees with their covariates and other associated data. Methods in Ecology and Evolution. doi:10.1111/2041-210X.12628.
