
upsetplot in ChIPseeker
ChIPseeker is an R package for ChIP peak annotation, comparison and visualization.
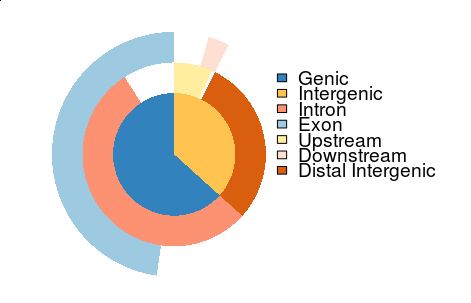
We have implemented several visualization methods, including vennpie that was designed for viewing annotation overlap as shown below:
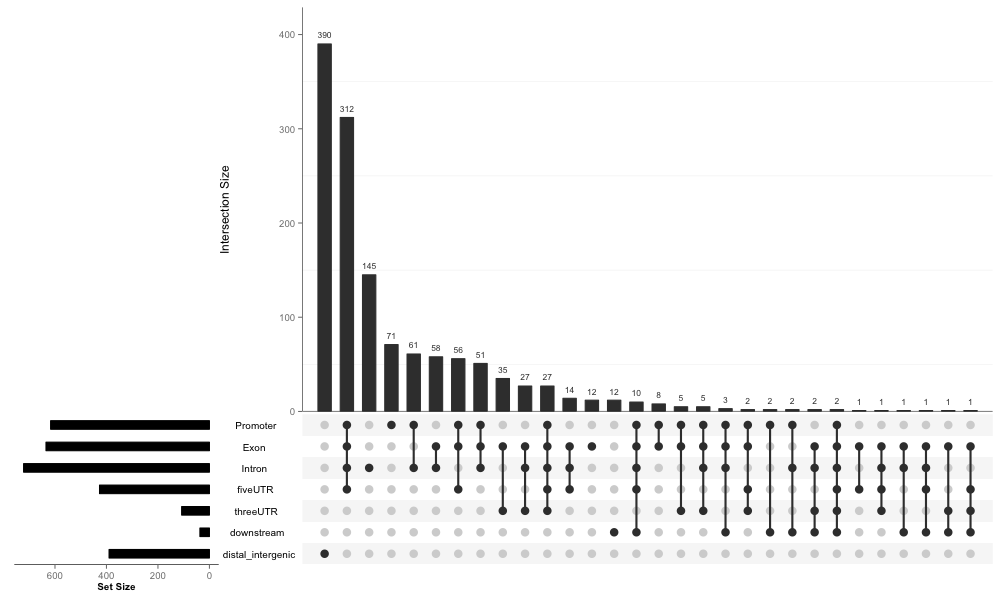
Not all overlap information can be demonstrated in vennpie. Upset is an effective way to visualize sets and intersections. We import upset function from UpSetR package and implement upsetplot function, that can visualize ChIP annotation overlap directly with output of annotatePeak.
library(ChIPseeker)
peak_file <- getSampleFiles()[[4]]
x <- annotatePeak(peak_file)
upsetplot(x)
We add a new parameter, vennpie=FALSE, in upsetplot. If vennpie=TRUE, a vennpie will be added as show below:
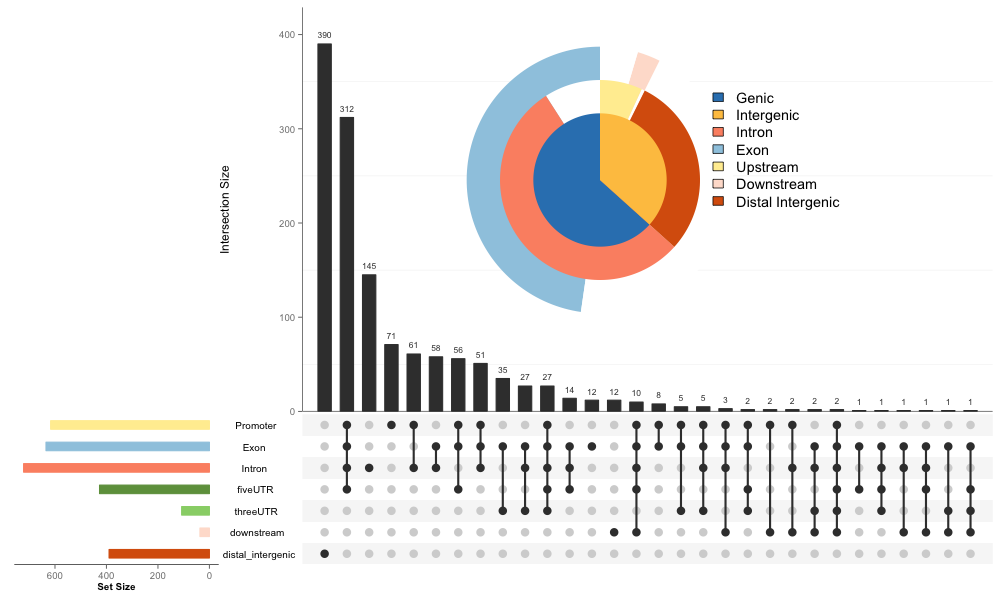
Although upset contains more information, vennpie is more intuitive and the final figure is more compact. More information is available at the online vignette.
Reference
- Alexander Lex, and Gehlenborg Nils. “Points of View: Sets and Intersections.” Nature Methods 11, no. 8 (August 2014): 779–779. doi:10.1038/nmeth.3033.
- Guangchuang Yu, Li-Gen Wang, and Qing-Yu He. ChIPseeker: An R/Bioconductor Package for ChIP Peak Annotation, Comparison and Visualization. Bioinformatics 31, no. 14 (July 15, 2015): 2382–83. doi:10.1093/bioinformatics/btv145.
- Conway Jake, and Gehlenborg Nils, “UpSetR”, https://github.com/cran/UpSetR.
