
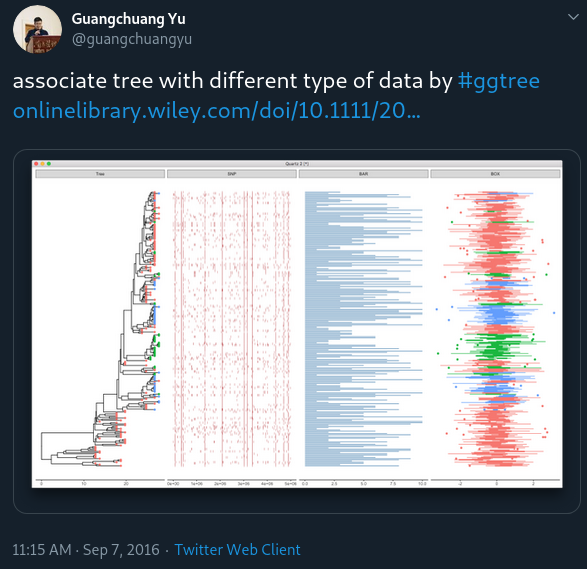
facet_plot: a general solution to associate data with phylogenetic tree
ggtree provides gheatmap for visualizing heatmap and msaplot for visualizing multiple sequence alignment with phylogenetic tree.
We may have different data types and want to visualize and align them with the tree. For example, dotplot of SNP site (e.g. using geom_point(shape='|')), barplot of trait values (e.g. using geom_barh(stat='identity')) et al.
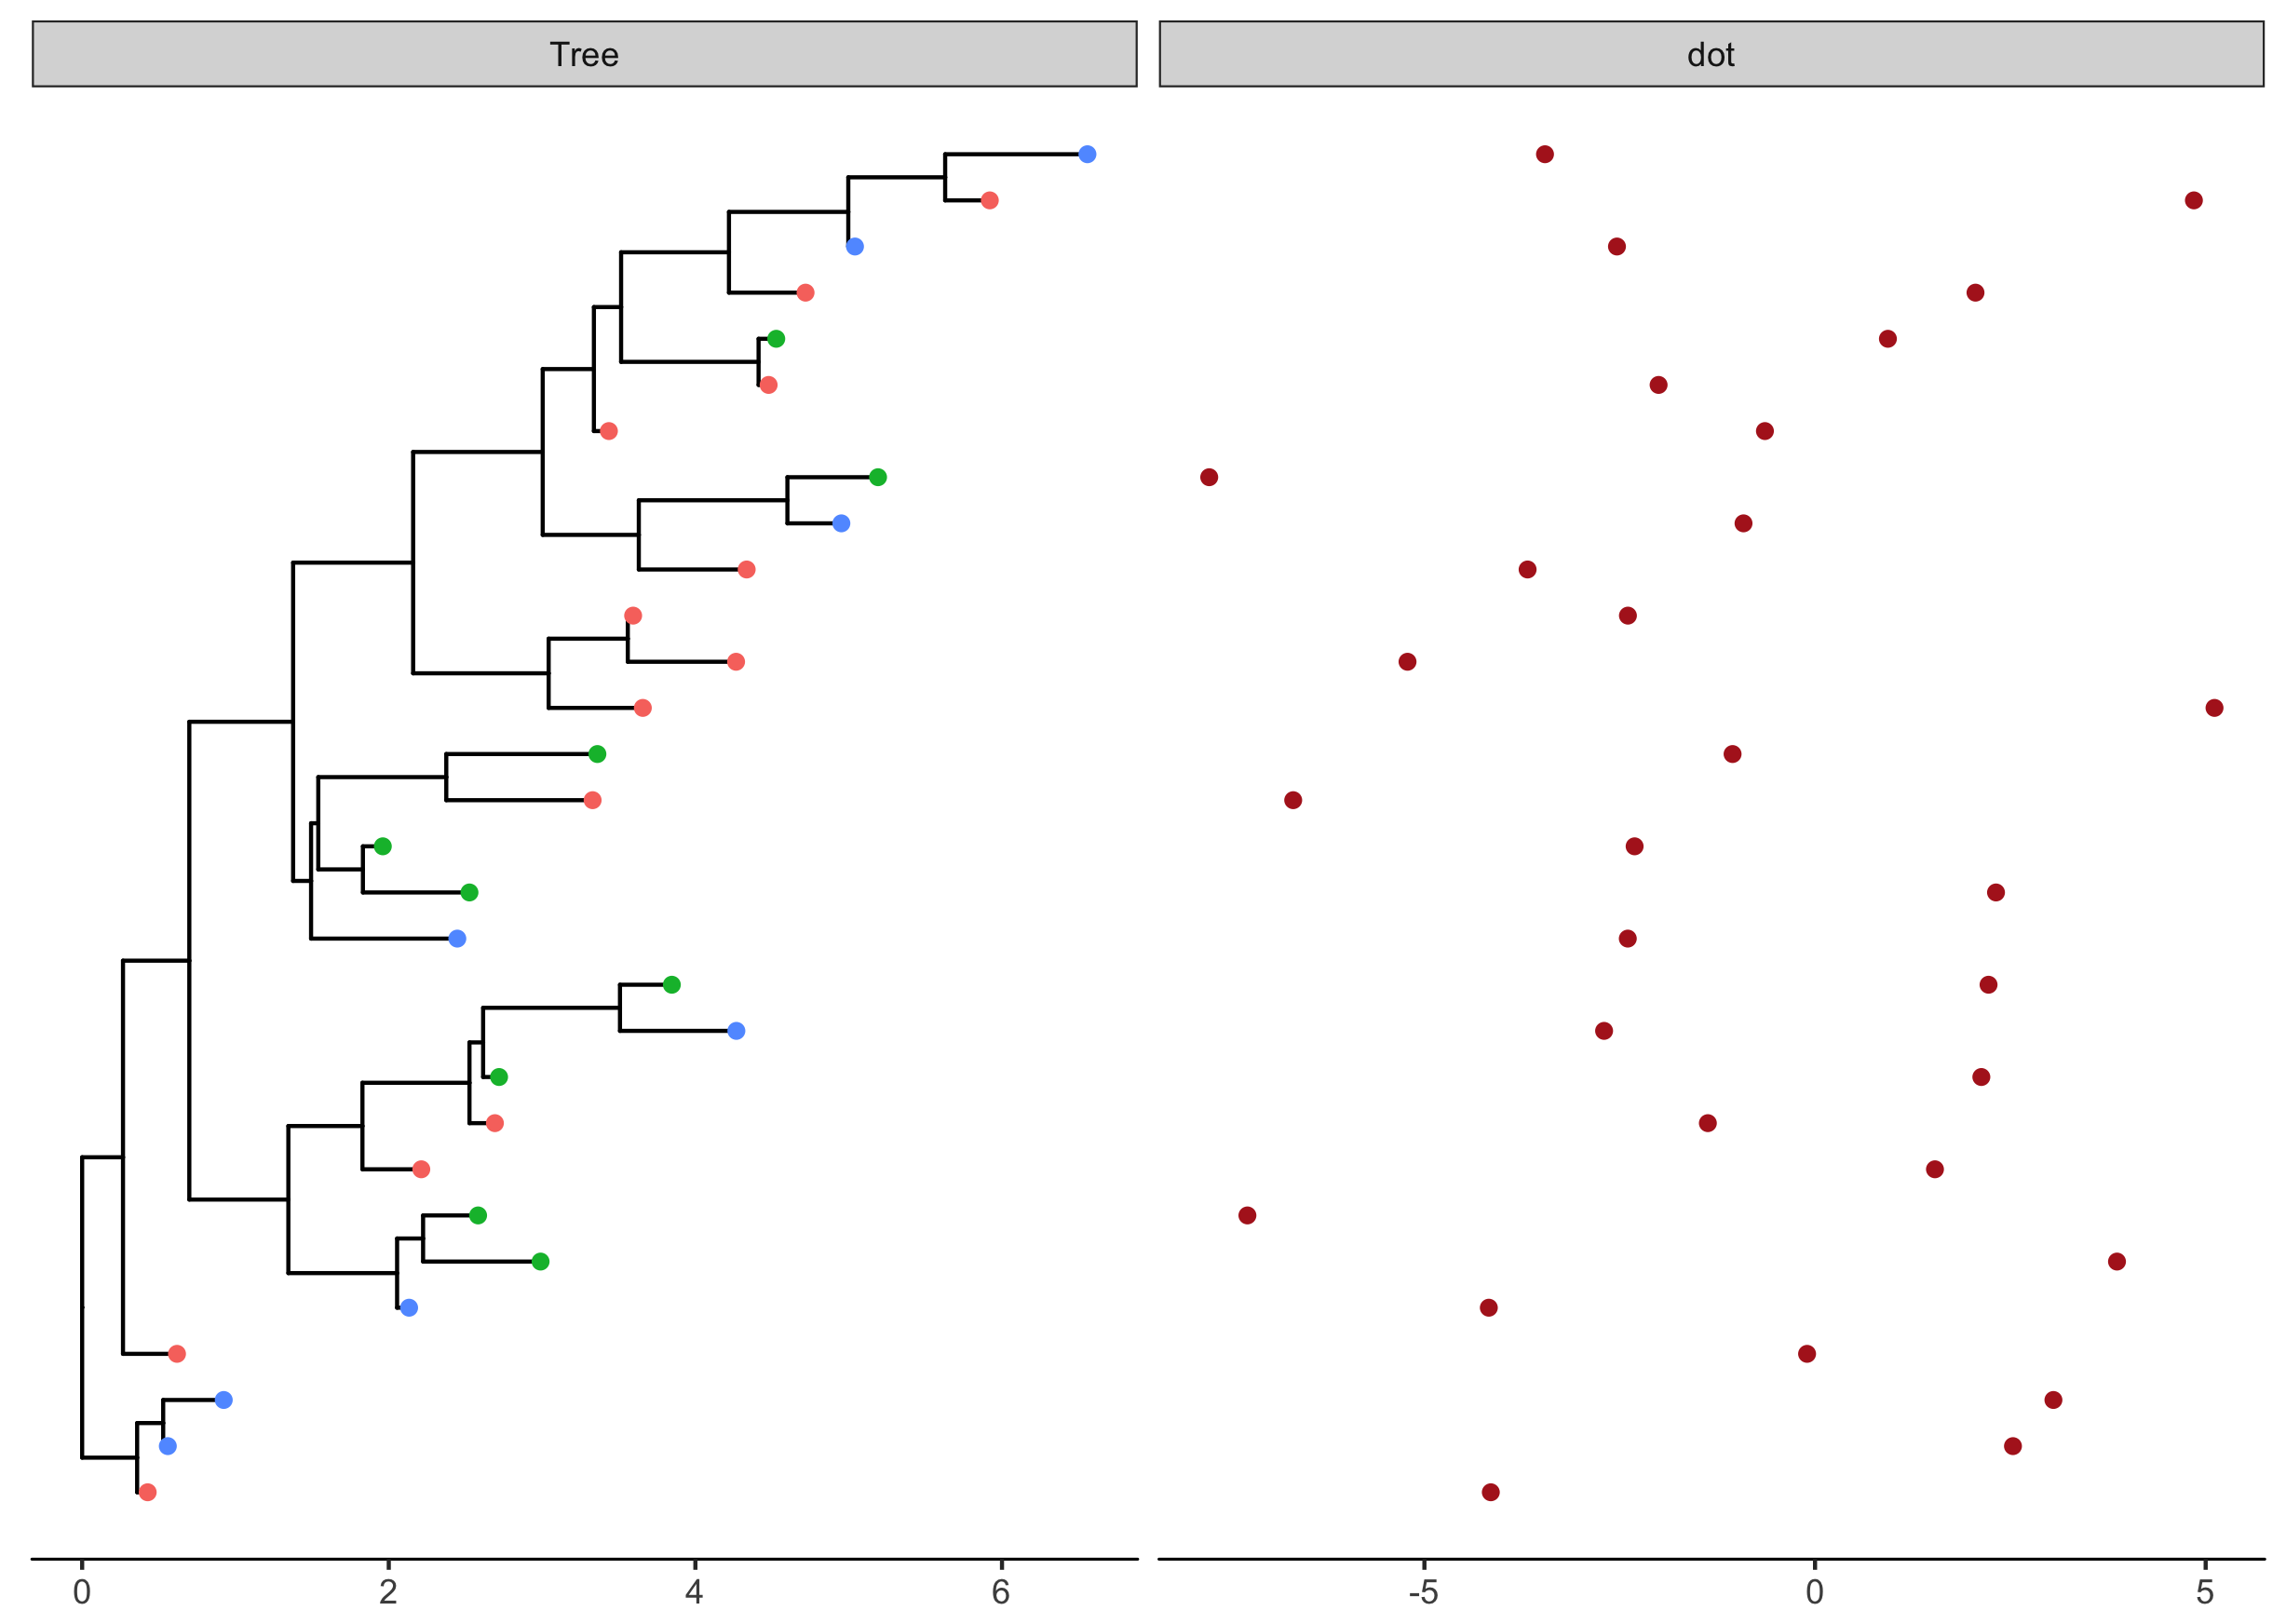
To make it easy to associate different types of data with phylogenetic tree, I implemented the facet_plot function which accepts a geom function to draw the input data.frame and display it in an additional panel.
tr <- rtree(30) p <- ggtree(tr) d1 <- data.frame(id=tr$tip.label, location=sample(c(“GZ”, “HK”, “CZ”), 30, replace=TRUE)) p1 <- p %<+% d1 + geom_tippoint(aes(color=location)) d2 <- data.frame(id=tr$tip.label, val=rnorm(30, sd=3)) p2 <- facet_plot(p1, panel=“dot”, data=d2, geom=geom_point, aes(x=val), color=‘firebrick’) + theme_tree2()
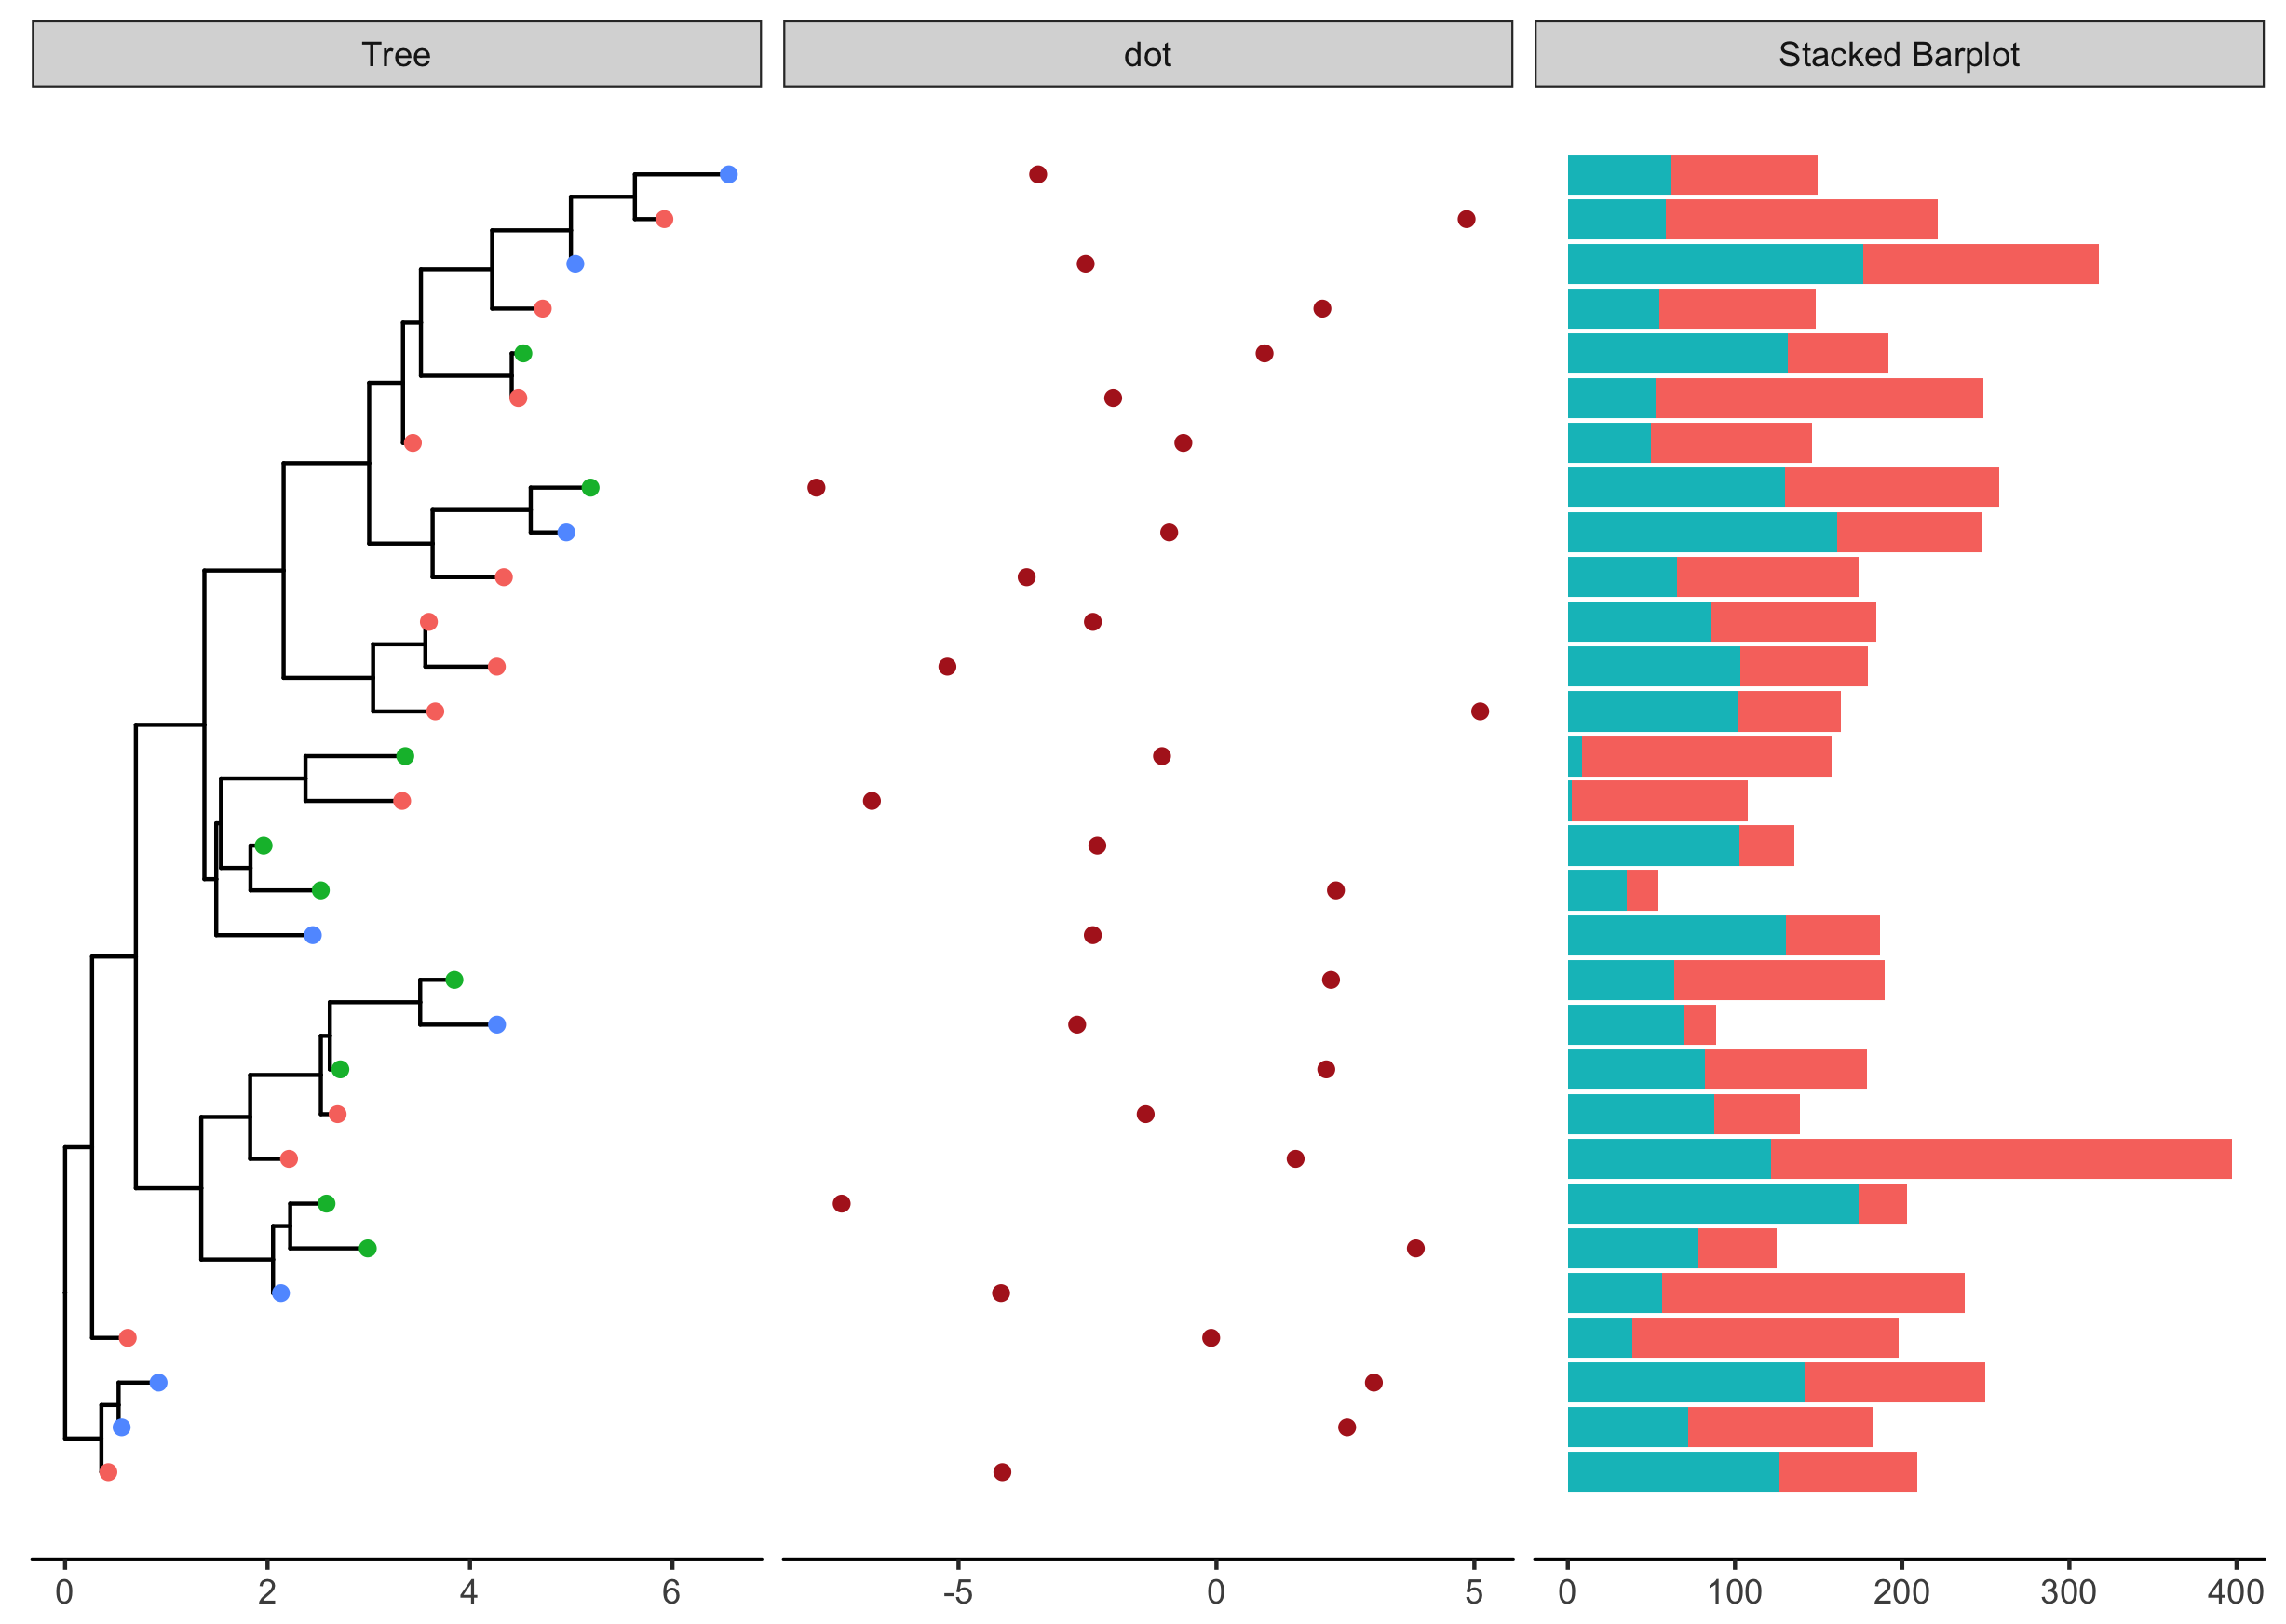
Most of the geom in ggplot2 draw vertical graph object, while for associating graph object with phylogenetic tree, we need horizontal versions. Luckily, we have ggstance which provides horizontal versions of geoms, including:
geom_barh()geom_histogramh()geom_linerangeh()geom_pointrangeh()geom_errorbarh()geom_crossbarh()geom_boxploth()geom_violinh()
With ggstance, we can associate barplot, boxplot or other graphs to phylogenetic trees.
library(ggstance)
d3 <- data.frame(id = rep(tr$tip.label, each=2),
					value = abs(rnorm(60, mean=100, sd=50)),
					category = rep(LETTERS[1:2], 30))
p3 <- facet_plot(p2, panel = 'Stacked Barplot', data = d3,
				geom = geom_barh,
				mapping = aes(x = value, fill = as.factor(category)),
				stat='identity' )
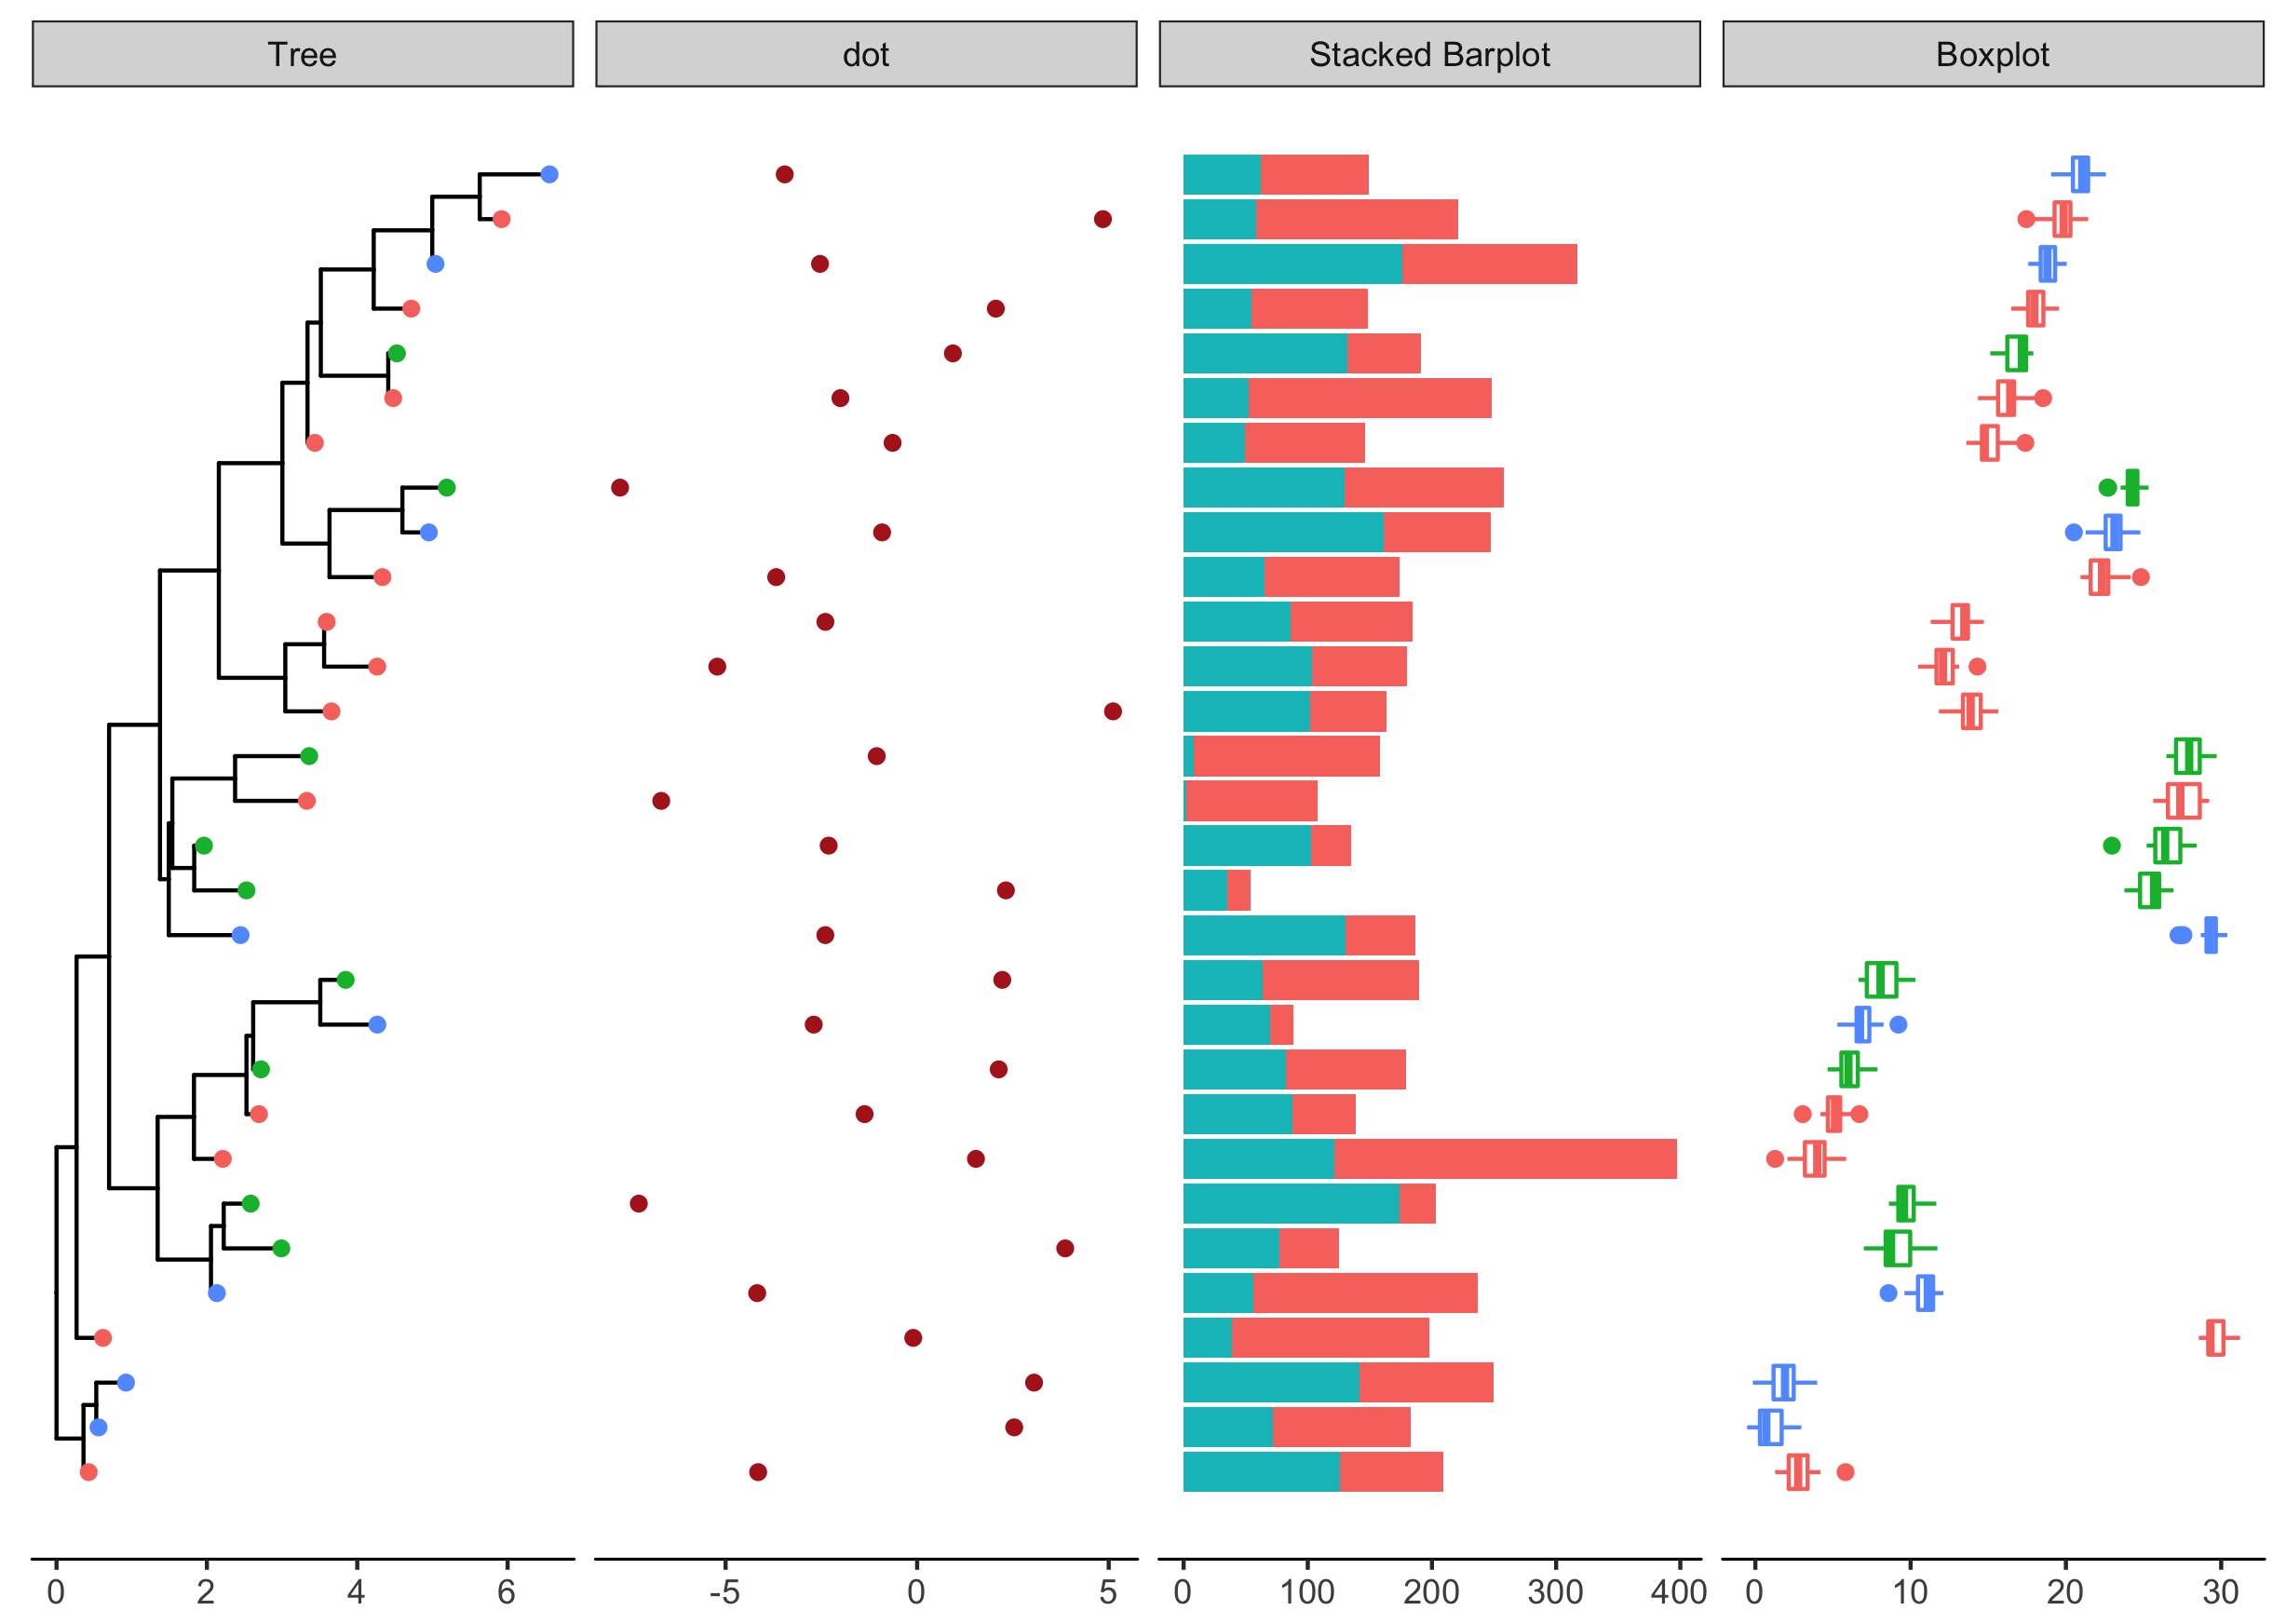
d4 = data.frame(id=rep(tr$tip.label, each=20),
				val=as.vector(sapply(1:30, function(i)
								rnorm(20, mean=i)))
				)
p4 <- facet_plot(p3, panel="Boxplot", data=d4, geom_boxploth,
			mapping = aes(x=val, group=label, color=location))
Citation
G Yu, DK Smith, H Zhu, Y Guan, TTY Lam*. ggtree: an R package for visualization and annotation of phylogenetic trees with their covariates and other associated data. Methods in Ecology and Evolution. doi:10.1111/2041-210X.12628.
