
xlim_tree: set x axis limits for only Tree panel
A ggtree user recently asked me the following question in google group:
I try to plot long tip labels in ggtree and usually adjust them using xlim(), however when creating a facet_plot xlim affects all plots and minimizes them.
Is it possible to work around this and only affect the tree and it’s tip labels leaving the other plots in facet_plot unaffected?
This is indeed a desire feature, as ggplot2 can’t automatically adjust xlim for text since the units are in two different spaces (data and pixel).
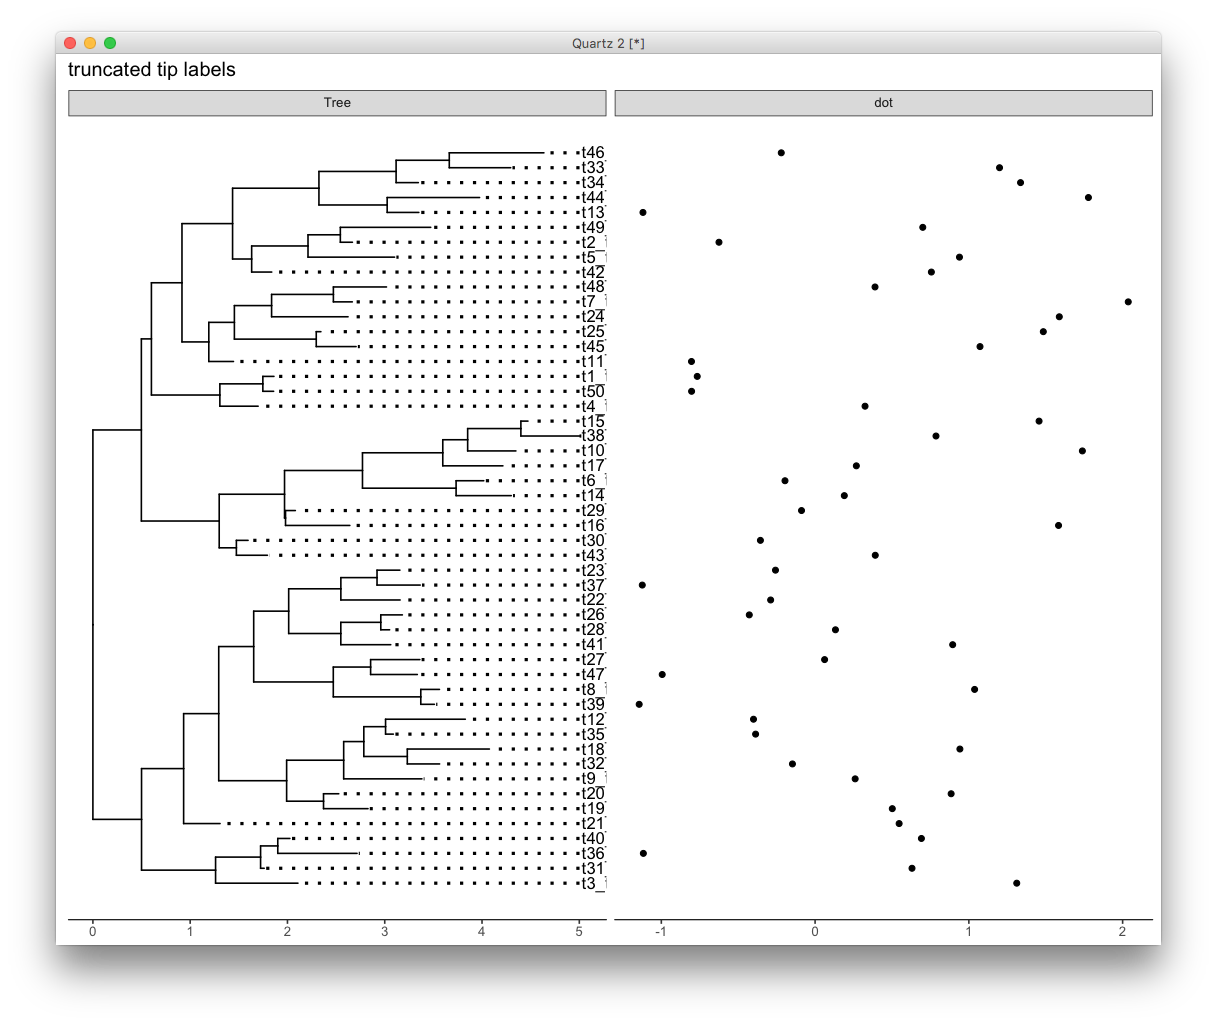
Here is an example, the tip labels are truncated.
library(ggtree)
set.seed(2016-10-31)
tr =rtree(50)
tr$tip.label = paste(tr$tip.label, tr$tip.label, sep="_")
p <- ggtree(tr) + geom_tiplab(align=TRUE) + theme_tree2()
d = data.frame(id = tr$tip.label, v= rnorm(50))

facet_plot(p, geom=geom_point, data=d, mapping=aes(x=v), panel='dot') +
		ggtitle("truncated tip labels")
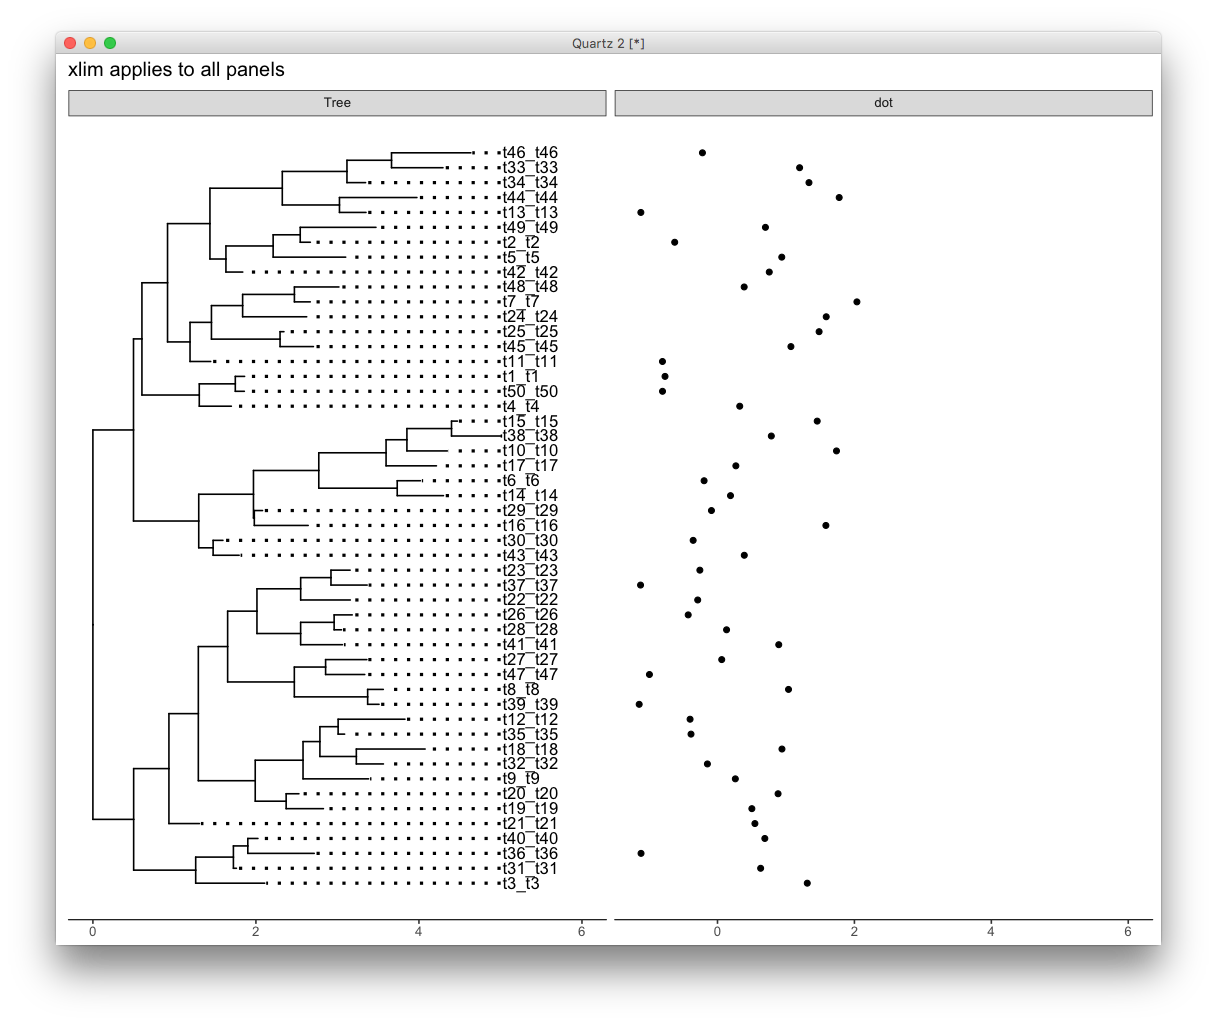
If we only visualize the tree, it is easy to solve by using xlim() to allocate more space for the lables. But xlim() works for all panels. Combination of facet_plot() and xlim() will produce figure with many spaces.
facet_plot(p+xlim(NA, 6), geom=geom_point, data=d, mapping=aes(x=v), panel='dot') +
		ggtitle("xlim applies to all panels")
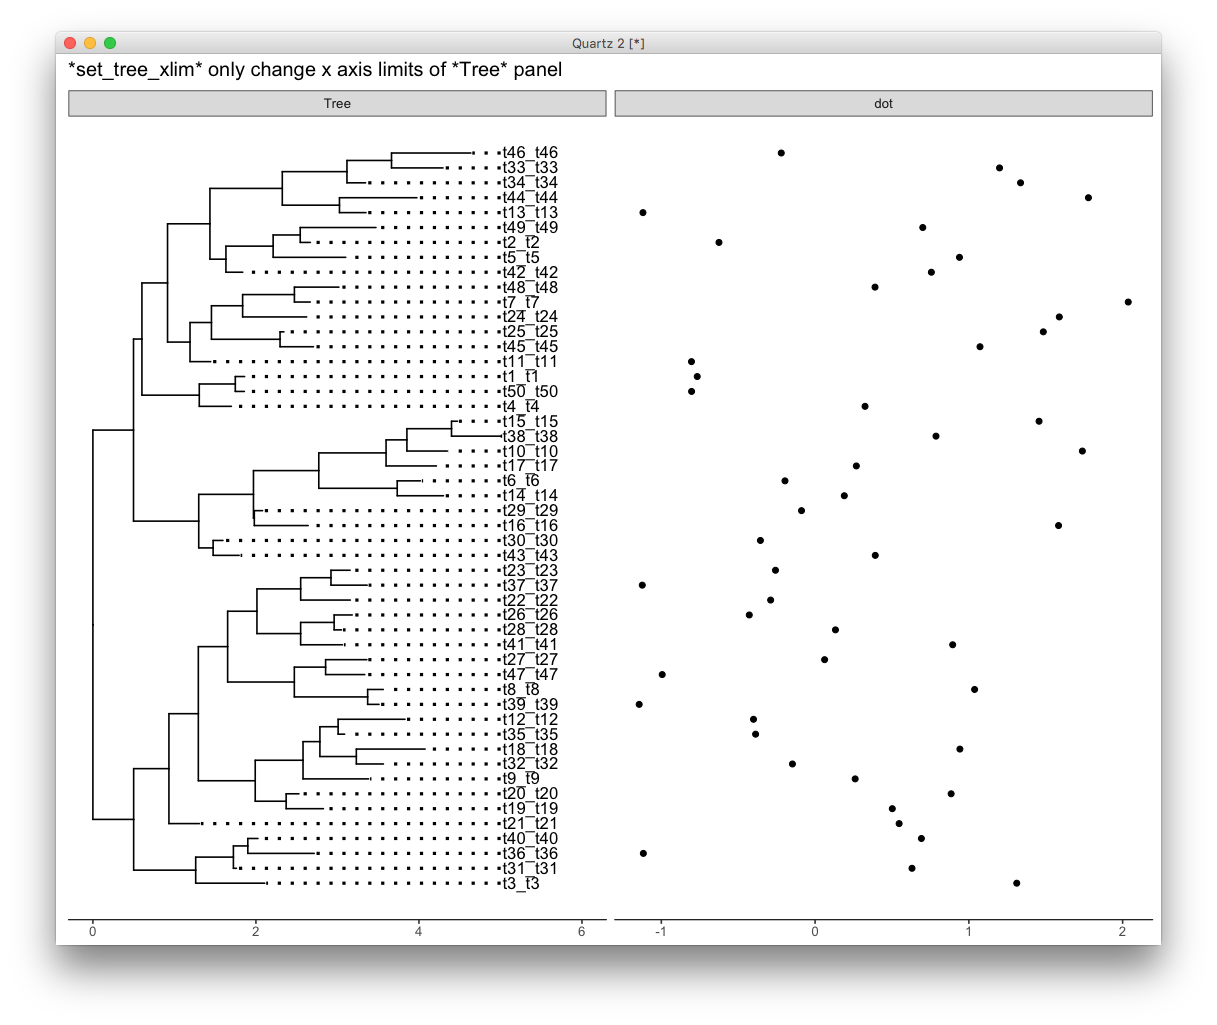
To overcome this issue, ggtree provides xlim_tree to set x axis limits for only the Tree panel.
facet_plot(p+xlim_tree(6), geom=geom_point, data=d, mapping=aes(x=v), panel='dot') +
		ggtitle('*xlim_tree* only change x axis limits of *Tree* panel')

# or using:
# facet_plot(p, geom=geom_point, data=d, mapping=aes(x=v), panel='dot') + xlim_tree(6)
Actually, you can set xlim for selected panel by using +xlim_expand(xlim, panel).
Citation
G Yu, DK Smith, H Zhu, Y Guan, TTY Lam*. ggtree: an R package for visualization and annotation of phylogenetic trees with their covariates and other associated data. Methods in Ecology and Evolution. doi:10.1111/2041-210X.12628.
