Bootstrap Method
统计推断(statistical inference)是基于样本统计值的抽样分布来计算的,抽样分布需要从总体中许多的样本来计算,在只有一个样本的情况下,bootstrap对这一随机样本进行有放回的重复抽样,每一个重抽样本与原始随机样本一样大,每次计算相应的抽样的统计值,重复了N次之后,就可以计算统计值的bootstrap分布。
下面做一个小小的试验:
a <- c(seq(1:10), rnorm(50))
#创建一个样本,60个数据,非正态分布的,如下图

b <- rep(0, 1000) for (i in 1:1000) { b[i] <- mean(sample(a, replace=TRUE)) }
对它进行1000次有放回重复抽样,计算均值,均值分布的柱状图和qq图如下:
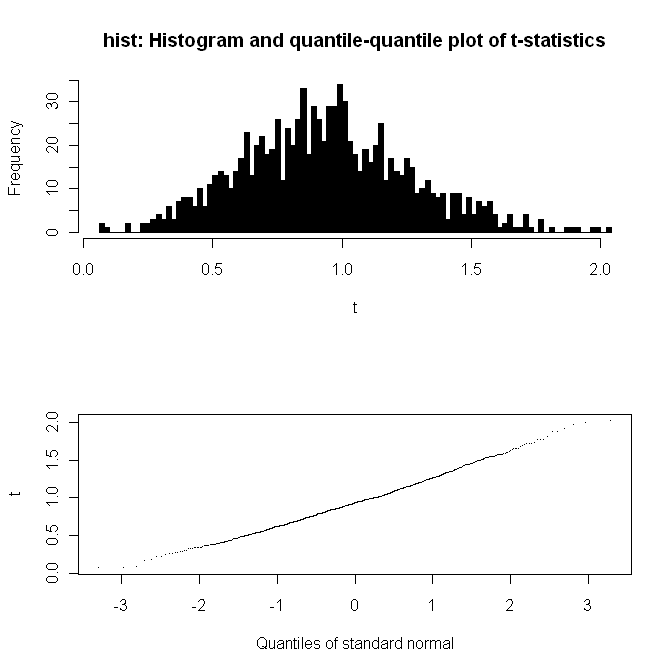
分布是正态的。
> mean(a)    #样本均值
[1] 0.947186
> mean(b)   #重抽样1000个样本均值的均值
[1] 0.9358049
> sd(b)
[1] 0.3245479
> sd(a)/sqrt(60)
[1] 0.3318863
由bootstrap方法得到的标准误是0.325,而由原先随机样本所估算的是0.332,两者是相当接近的。由此可见呢,bootstrap方法与理论上的从总体中抽样所得到的样本分布是一致的,这样子就可以基于一个样本来计算样本的分布,而不是要从总体中抽N个样本。
还用上面的例子,使用样本均值$ \bar{x}$去估算总体的均值$\mu$,虽然我们的样本不是正态的,但如果bootstrap distribution是正态的话,就可以使用类似于单样本t置信区间(要求样本是正态的)的公式:$ \bar{x} \pm t \cdot SE = \bar{x} \pm t \cdot \frac{s}{\sqrt{n}}$ 相应的bootstrap t置信区间是:$ statistic \pm t \cdot SE_{boot}$ 上面例子,总体均值$ \mu$ 95%的置信度,就会落在:$ mean(a) \pm 2.009 \cdot sd(b)$ 可以使用它,计算所有统计指标的置信区间。
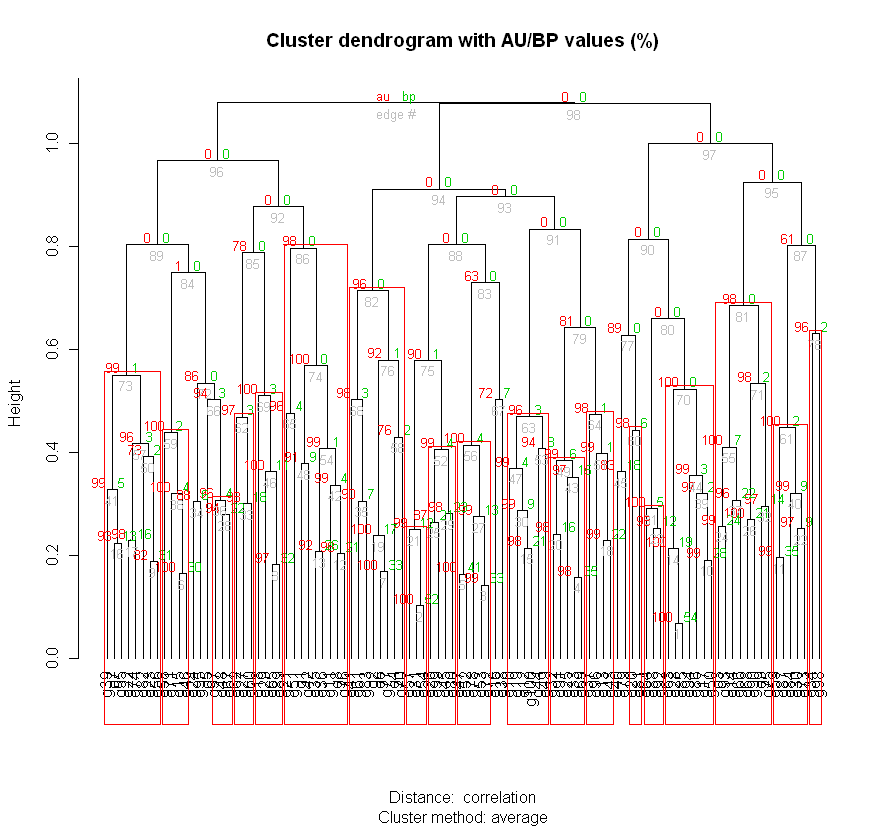
用于层次聚类分析的一个例子,使用Pvclust这个包,用于层次聚类,并通过multiscale bootstrap resampling给出相应的p-value用于评估聚类结果的不确定性。提供了两种p-values,AU(approximately unbiased p-value, 通过multiscale bootstrap resampling计算)和BP(bootstrap probability, 通过normal bootstrap resampling计算),AU比BP较为unbiased。 Pvclust使用*hclust*(来自于stats包)进行层次聚类,并自动计算所有的子类的p-value。
library(pvclust)  # loads package
a <- matrix(rnorm(1000), 100, 10, dimnames=list(paste("g", 1:100, sep=""), paste("t",1:10, sep="")))  # creats sample data
at <- t(a)  # transposes of a
cl <- pvclust(at, nboot=1000)  #performs hierarchical cluster analysis with multiscale bootstrap with 1000 repetitions.
pvrect(cl, alpha=0.95)  #highlights with red rectangles all clusters in the dendrogram which have an AU value above 95%, AU p-value > 0.95, the hypothesis that "the cluster does not exist" is rejected with significance level 0.05;
#pick significant clusters.
clsig <- pvpick(cl, alpha=0.95, pv="au", type="geq", max.only=TRUE)
Reference
1. Moore, D.S., McCabe, G.P. & Craig, B. Introduction to the Practice of Statistics w/CD-ROM. (W. H. Freeman: 2007).
2. Suzuki, R. (2006). Pvclust: an R package for assessing the uncertainty in hierarchical clustering, Bioinformatics, 22(12), 1540-1542 DOI:10.1093/bioinformatics/btl117