主成分分析
使用《Bioinformatics and Molecular Evolution》Table 2.2 (page 24)中的数据:
> aa
  VOL  BULK POLARITY    PI HYD1  HYD2 SURFACE_AREA FRACT_AREA
A  67 11.50     0.00  6.00  1.8   1.6          113       0.74
R 148 14.28    52.00 10.76 -4.5 -12.3          241       0.64
N  96 12.28     3.38  5.41 -3.5  -4.8          158       0.63
D  91 11.68    49.70  2.77 -3.5  -9.2          151       0.62
C  86 13.46     1.48  5.05  2.5   2.0          140       0.91
Q 114 14.45     3.53  5.65 -3.5  -4.1          189       0.62
E 109 13.57    49.90  3.22 -3.5  -8.2          183       0.62
G  48  3.40     0.00  5.97 -0.4   1.0           85       0.72
H 118 13.69    51.60  7.59 -3.2  -3.0          194       0.78
I 124 21.40     0.13  6.02  4.5   3.1          182       0.88
L 124 21.40     0.13  5.98  3.8   2.8          180       0.85
K 135 15.71    49.50  9.74 -3.9  -8.8          211       0.52
M 124 16.25     1.43  5.74  1.9   3.4          204       0.85
F 135 19.80     0.35  5.48  2.8   3.7          218       0.88
P  90 17.43     1.58  6.30 -1.6  -0.2          143       0.64
S  73  9.47     1.67  5.68 -0.8   0.6          122       0.66
T  93 15.77     1.66  5.66 -0.7   1.2          146       0.70
W 163 21.67     2.10  5.89 -0.9   1.9          259       0.85
Y 141 18.03     1.61  5.66 -1.3  -0.7          229       0.76
V 105 21.57     0.13  5.96  4.2   2.6          160       0.85
> aa.pc=prcomp(aa, center=TRUE, scale.=TRUE)
> aa.pc
Standard deviations:
[1] 1.88954924 1.67729608 0.88574923 0.65278312 0.53130822 0.27233782 0.21394709
[8] 0.05808934

Rotation:
                     PC1         PC2           PC3         PC4        PC5
VOL           0.05790316 -0.58494270  0.1057571970 -0.09311996  0.1684497
BULK         -0.22089815 -0.48085679  0.1685873871 -0.15647005 -0.6842181
POLARITY      0.44390146 -0.10372198  0.1432388489  0.73088587 -0.1747201
PI            0.18580066 -0.25244261 -0.9417631776  0.02722752 -0.0522075
HYD1         -0.49279466 -0.03284274 -0.1281013177  0.35033569 -0.3534423
HYD2         -0.50821923  0.03312719 -0.1292531953 -0.12776013  0.1837842
SURFACE_AREA  0.10045084 -0.56587879  0.1408585179 -0.10640314  0.3652725
FRACT_AREA   -0.45283231 -0.17244828  0.0009997326  0.53059489  0.4220135
                     PC6         PC7          PC8
VOL          -0.11705506  0.21351836 -0.739571539
BULK          0.25124136 -0.35181704  0.109655303
POLARITY      0.39252691  0.22974777  0.009653888
PI            0.04562347 -0.09136074  0.030622127
HYD1         -0.50083501  0.48686655  0.064292387
HYD2          0.70974650  0.41191312 -0.019940539
SURFACE_AREA -0.11107422  0.24097250  0.659316956
FRACT_AREA   -0.01018472 -0.55201871 -0.027363410
> summary(aa.pc)
Importance of components:
                          PC1    PC2     PC3     PC4     PC5     PC6     PC7
Standard deviation     1.8895 1.6773 0.88575 0.65278 0.53131 0.27234 0.21395
Proportion of Variance 0.4463 0.3517 0.09807 0.05327 0.03529 0.00927 0.00572
Cumulative Proportion  0.4463 0.7980 0.89603 0.94930 0.98459 0.99386 0.99958
                           PC8
Standard deviation     0.05809
Proportion of Variance 0.00042
Cumulative Proportion  1.00000
PC1和PC2能够解释79.8%的variation。
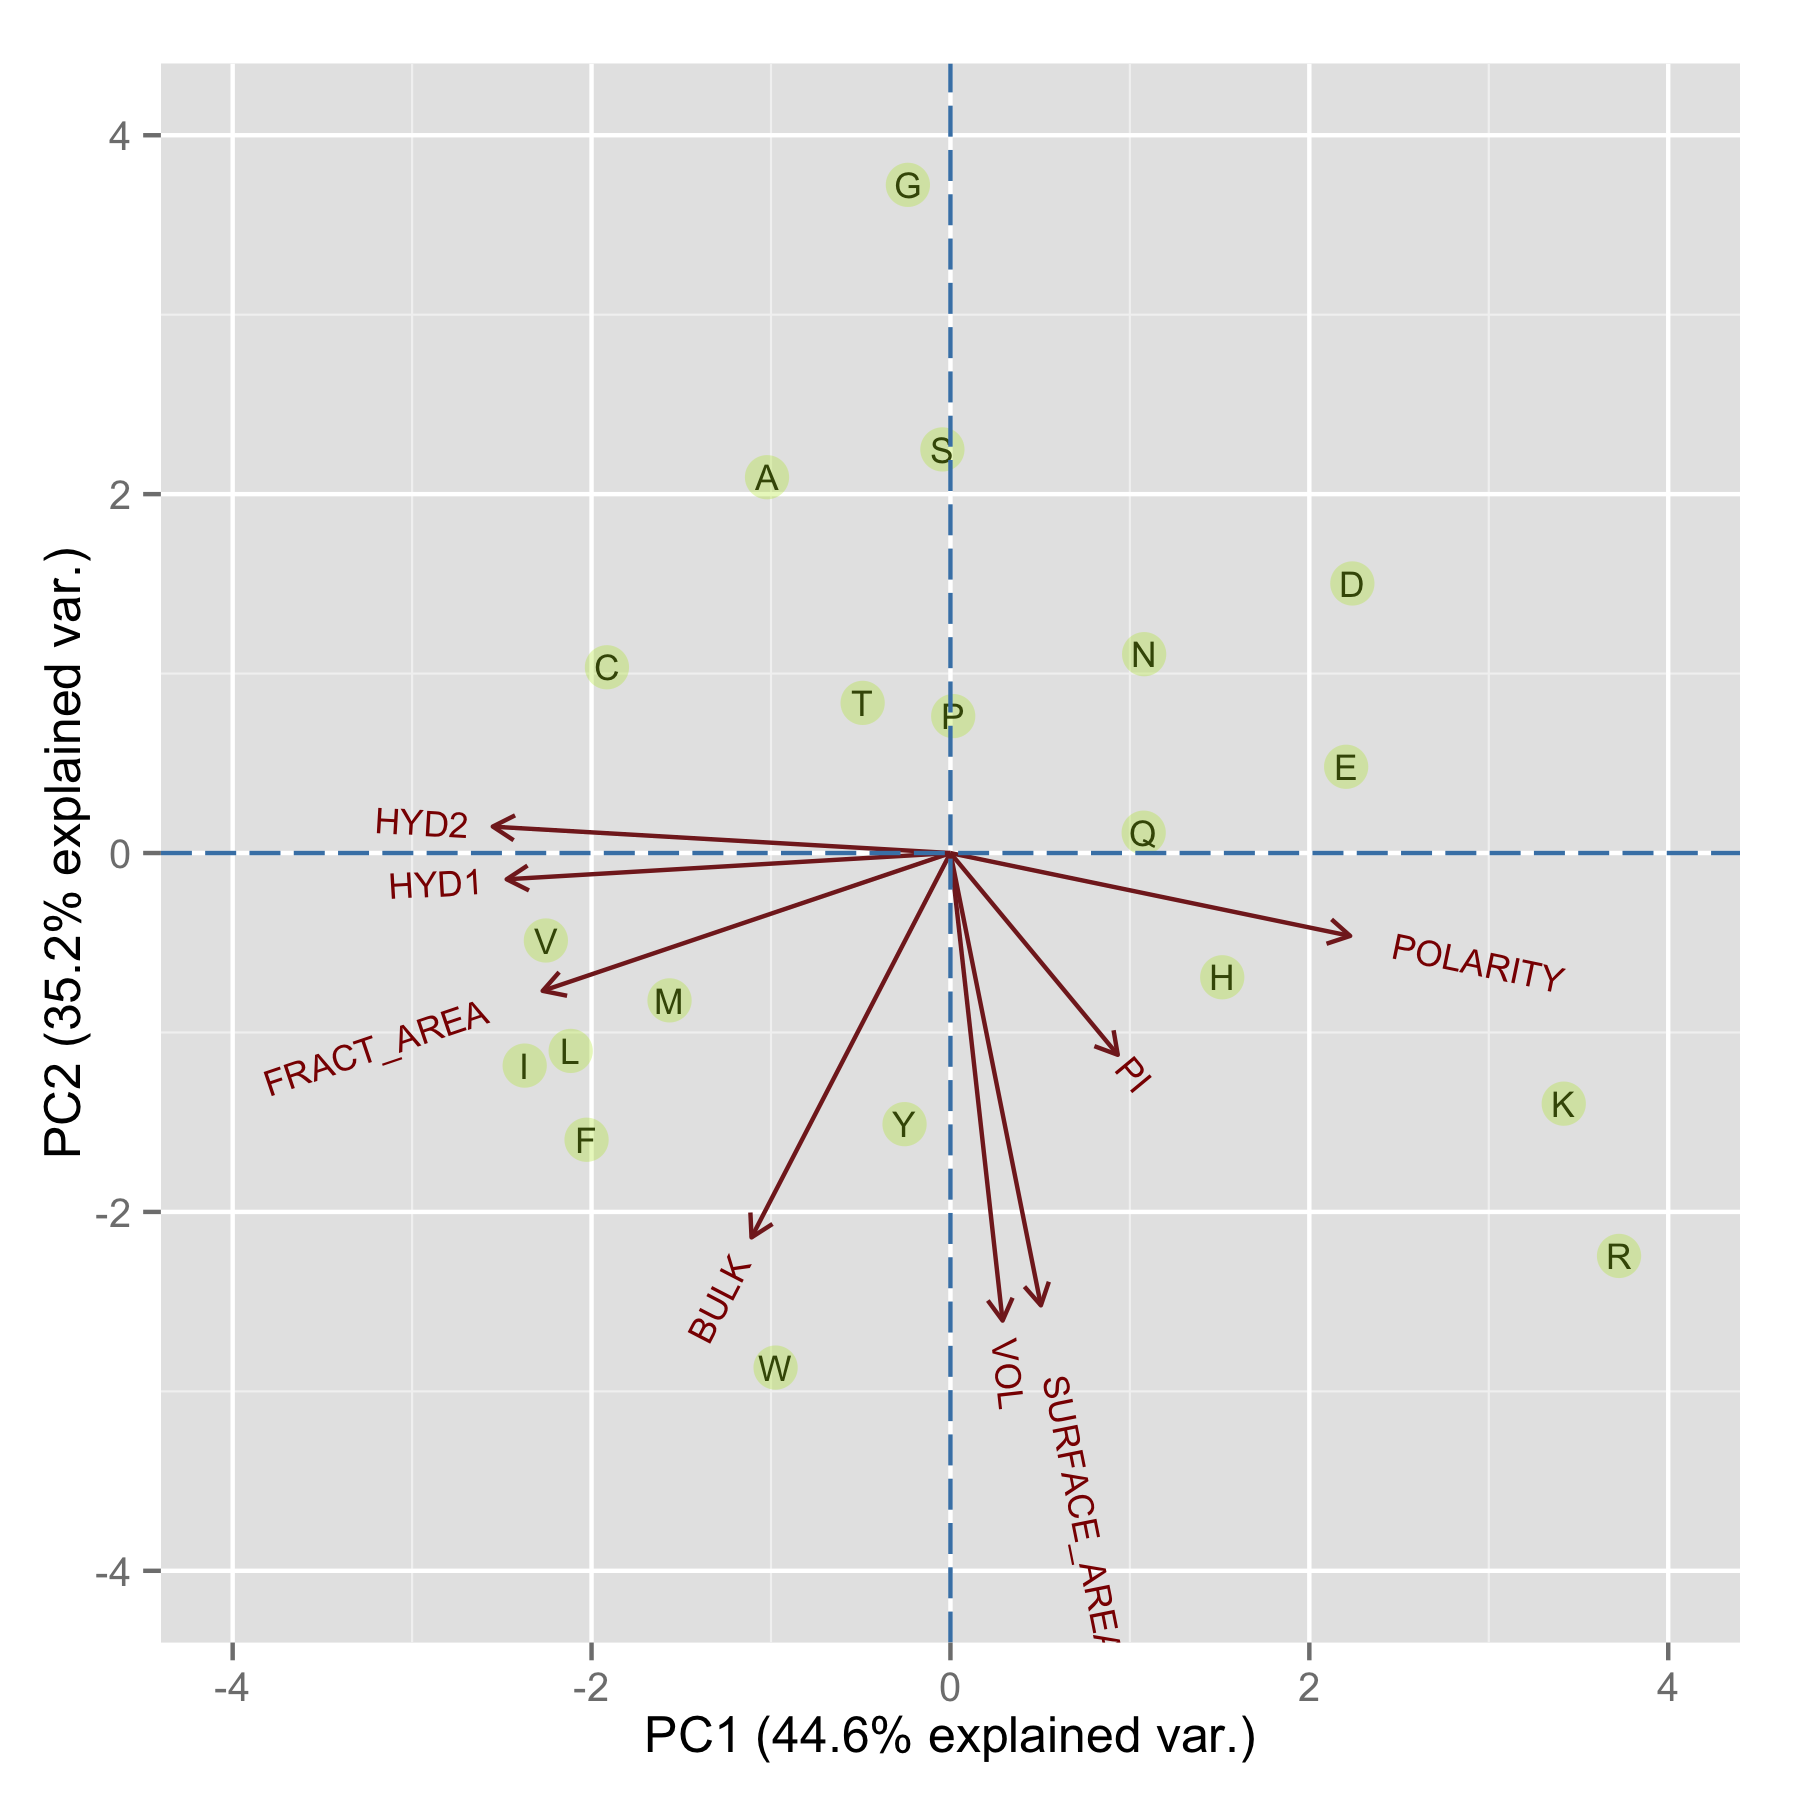
PC1主要是疏水性和极性,从图中可以看出I, L, V, M和F这几个中等SIZE的疏水氨基酸聚成一类,D和E这两个酸性氨基酸,Q和N这两个酰胺也比较接近,而碱性氨基酸K和R也很接近,H也算是和K,R较近。
PC2主要是分子体积和bulkiness,最大的氨基酸W和Y中靠得比较近。在这个PCA的图中,很多氨基酸相似的特性还是很好地能够呈现出来。