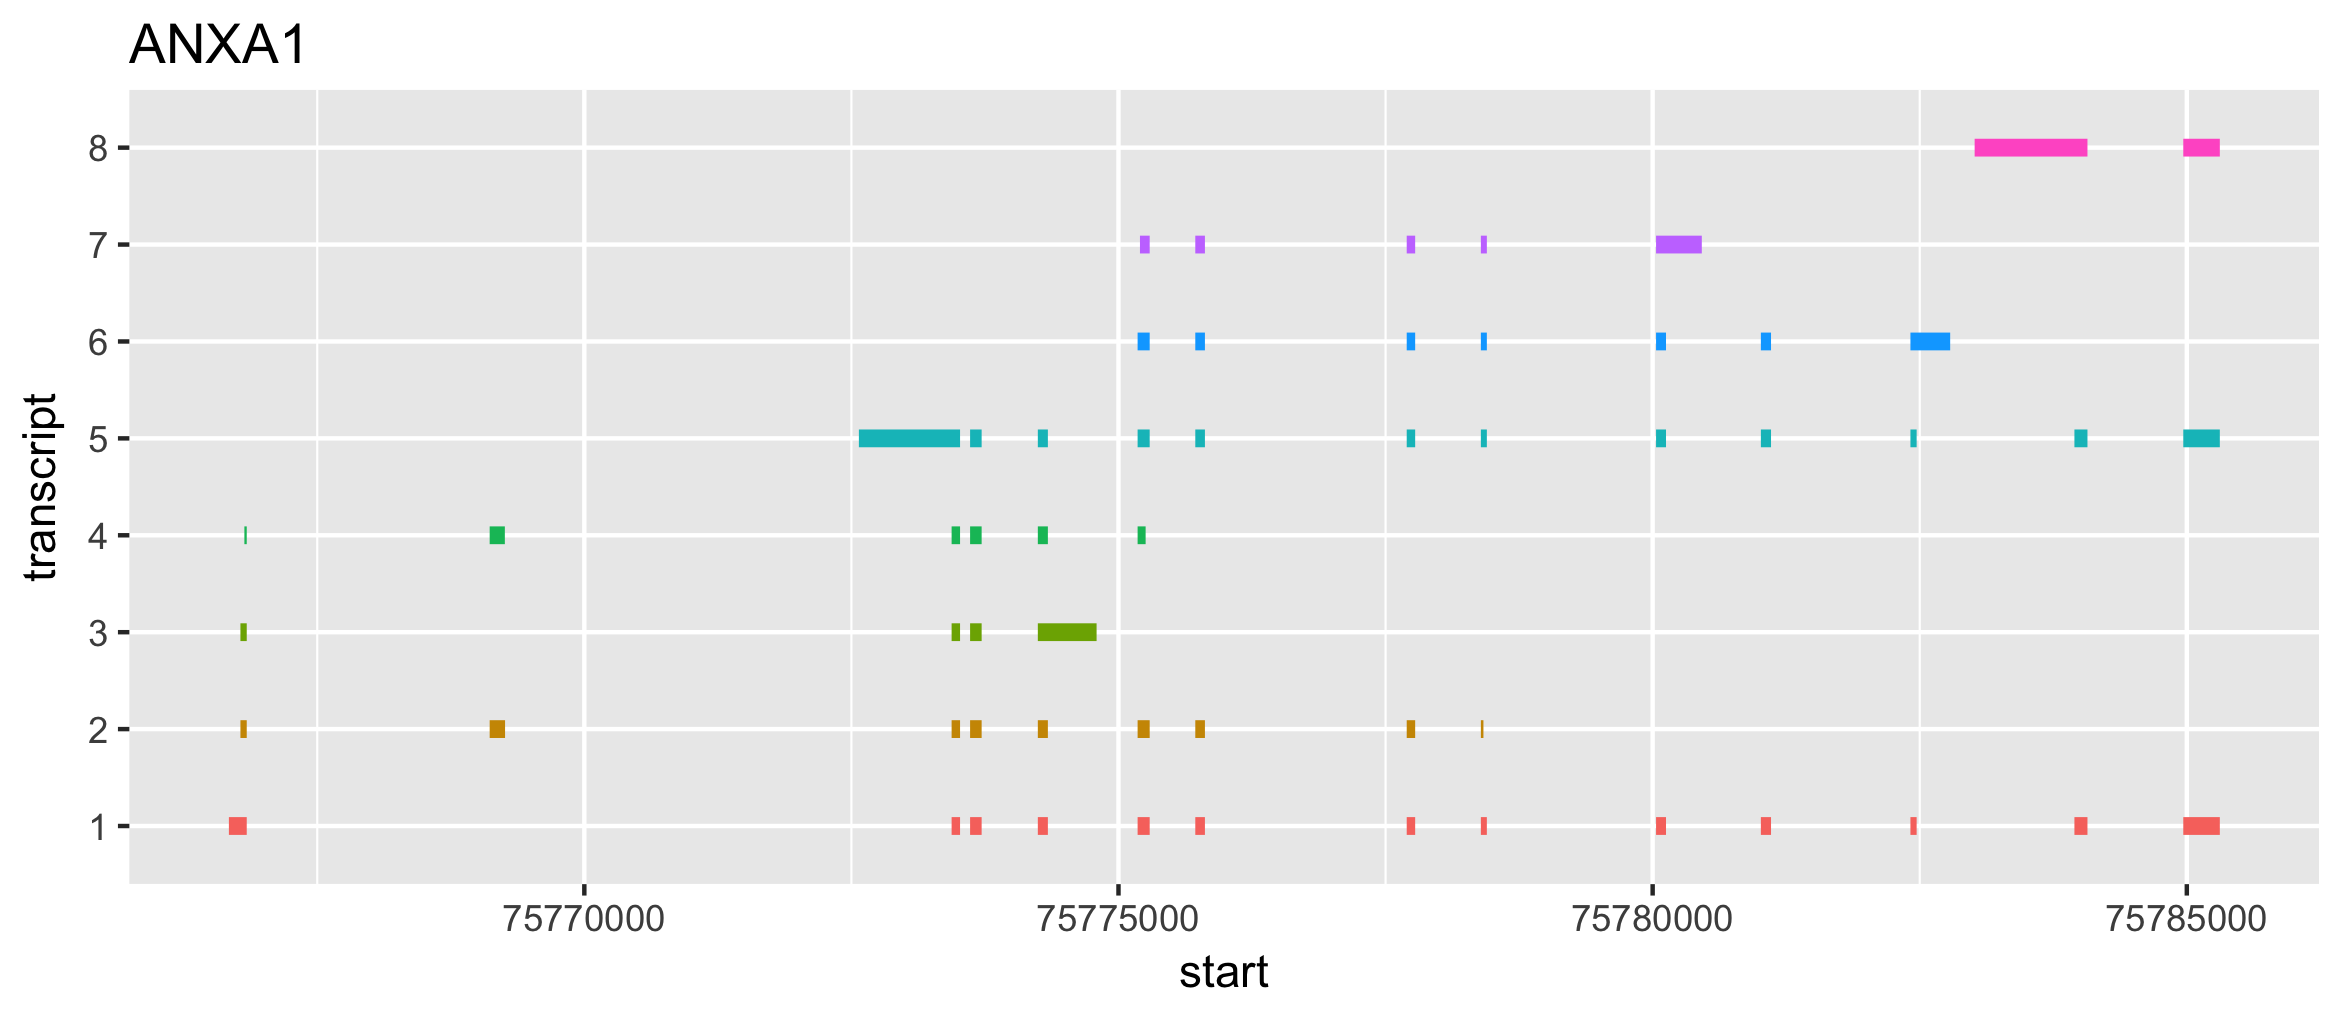
根据GTF画基因的多个转录本结构
这是生物技能树的一道习题,使用了base plot来画,做为补充,我使用ggplot2来重画一遍。
url <- "http://www.broadinstitute.org/cancer/cga/sites/default/files/data/tools/rnaseqc/gencode.v7.annotation_goodContig.gtf.gz"
tmpfile <- tempfile(fileext=".gtf.gz")
download.file(url, tmpfile)
gtf <- read.table(tmpfile,stringsAsFactors = F,
                  header = F,comment.char = "#",sep = '\t'
                  )
gtf <- gtf[gtf[,2] =='HAVANA',]
gtf <- gtf[grepl('protein_coding',gtf[,9]),]
gtf$gene <- sapply(as.character(gtf[,9]), function(x) sub(".*gene_name\\s([^;]+);.*", "\\1", x))

draw_gene <- 'ANXA1'
structure <- gtf[gtf$gene==draw_gene,c(1,3:5)]
names(structure) <- c("chr", "record", "start", "end")
idx <- which(structure$record == "transcript")
s <- idx+1
e <- c(idx[-1]-1, nrow(structure))
g <- lapply(seq_along(s), function(i) {
  x <- structure[s[i]:e[i],]
  x$transcript <- i
  return(x)
}) %>% do.call(rbind, .)

g <- g[g$record == "exon",]
g$transcript <- factor(g$transcript)

library(ggplot2)
ggplot(g) +
	geom_segment(aes(x=start, xend=end, y=transcript, yend=transcript, color=transcript), size=2) +
	theme(legend.position="none") + labs(title="ANXA1")