annotate tree with user specific data
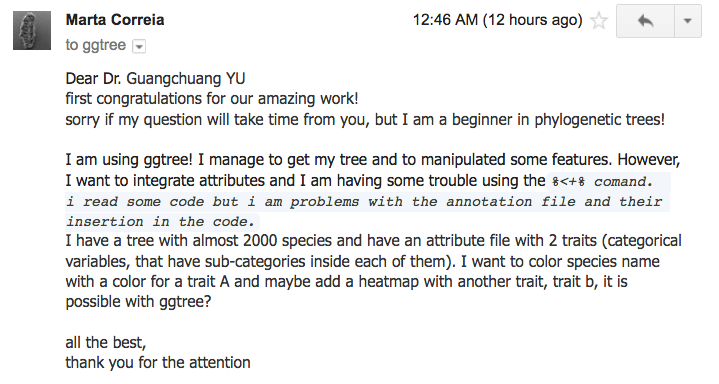
最新的一个问题,大致讲他有两个trait, A和B,想拿A来给label上色,B来画热图。
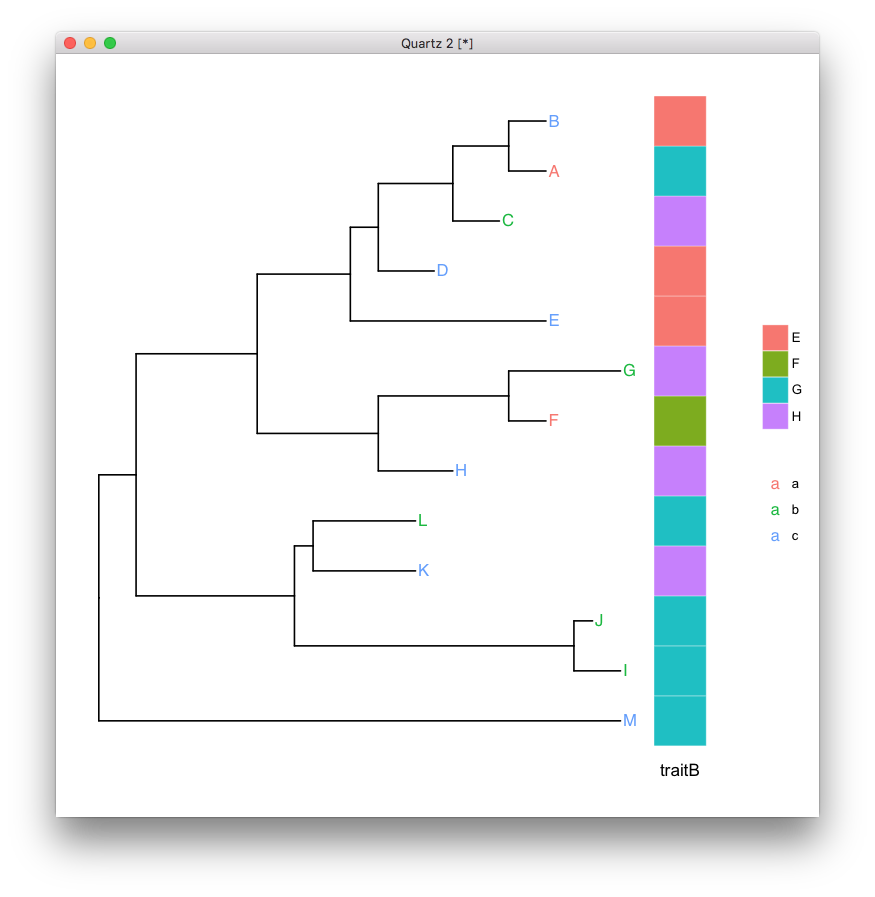
加载用户数据我们有%<+%操作符,热图有gheatmap函数。
我给了他一个简单的例子:
library("ggtree")
nwk <- system.file("extdata", "sample.nwk", package="treeio")
tree <- read.tree(nwk)
n <- Ntip(tree)

set.seed(123)
df <- data.frame(label = tree$tip.label,
              traitA = sample(letters[1:3], n, replace=T),
              traitB = sample(LETTERS[5:8], n, replace=T))
row.names(df) <- df[,1]

p1 <- ggtree(tree) %<+% df + geom_tiplab(aes(color=traitA))
gheatmap(p1, df[,"traitB", drop=FALSE], offset = 0.8, width=0.1)
G Yu, DK Smith, H Zhu, Y Guan, TTY Lam*. ggtree: an R package for visualization and annotation of phylogenetic trees with their covariates and other associated data. Methods in Ecology and Evolution. 2017, 8(1):28-36.