按地理位置进行分面
CRAN刚上线的新包geofacet,可以让ggplot2分面按指定的地理位置来,比如下面的数据,美国各州各项指标的排名:
  head(state_ranks)
    state   name   variable rank
1    AK Alaska  education   28
2    AK Alaska employment   50
3    AK Alaska     health   25
4    AK Alaska     wealth    5
5    AK Alaska      sleep   27
6    AK Alaska    insured   50
我们正常画图是这样子的:
ggplot(state_ranks, aes(variable, rank, fill = variable)) +
  geom_col() +
  coord_flip() +
  theme_bw() +
  facet_wrap(~ state)
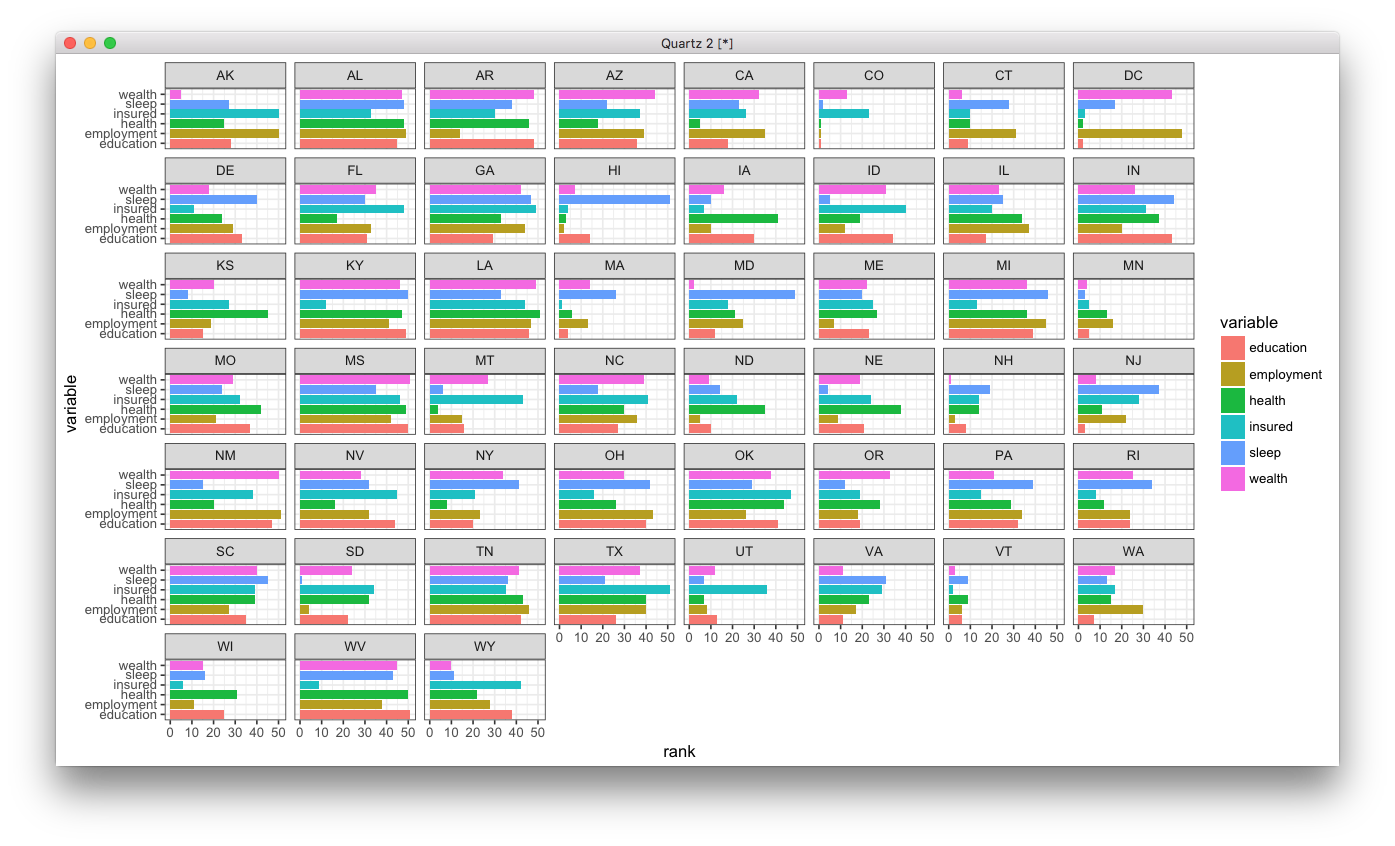
这个geofacet包的引入了facet_geo,用法和facet_wrap一模一样,所以如果你会用facet_wrap分面的话,你已然会了:
ggplot(state_ranks, aes(variable, rank, fill = variable)) +
  geom_col() +
  coord_flip() +
  theme_bw() +
  facet_geo(~ state)
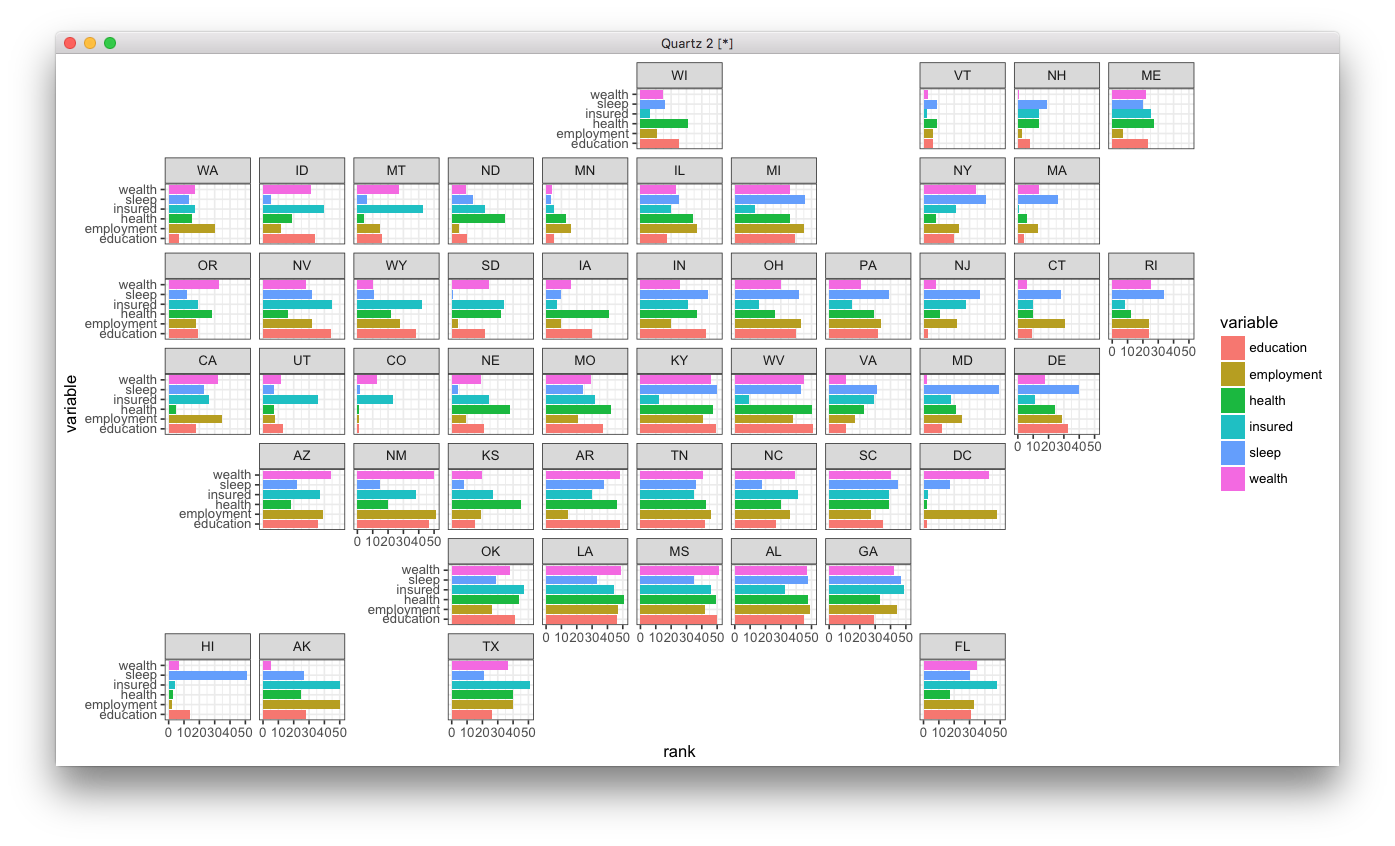
然后它还可以通过手工指定位置,比如下面这个:
head(us_state_grid2)
  row col code       name
1   6   7   AL    Alabama
2   1   1   AK     Alaska
3   6   2   AZ    Arizona
4   6   5   AR   Arkansas
5   6   1   CA California
6   5   3   CO   Colorado
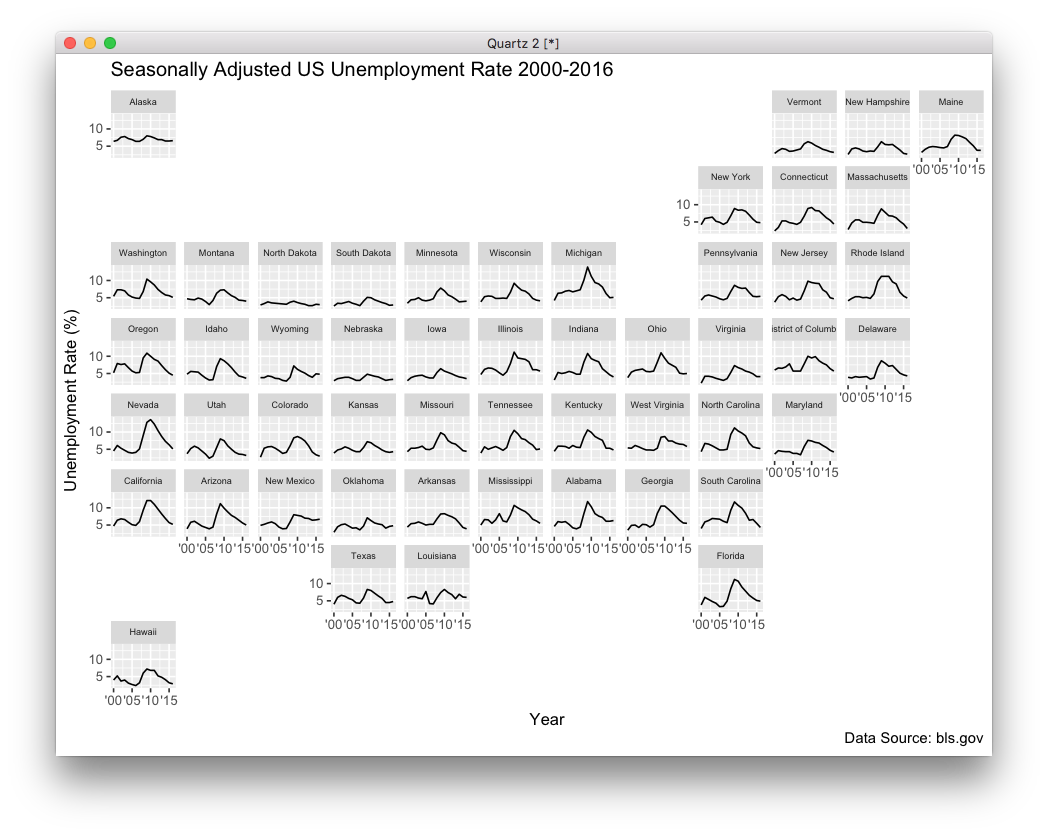
可以通过grid参数指定,label参数可以指定分面用什么变量来label:
ggplot(state_unemp, aes(year, rate)) +
  geom_line() +
  facet_geo(~ state, grid = "us_state_grid2", label = "name") +
  scale_x_continuous(labels = function(x) paste0("'", substr(x, 3, 4))) +
  labs(title = "Seasonally Adjusted US Unemployment Rate 2000-2016",
    caption = "Data Source: bls.gov",
    x = "Year",
    y = "Unemployment Rate (%)") +
  theme(strip.text.x = element_text(size = 6))
geofacet包里自带了一些geo grid信息:
> get_grid_names()
 [1] "us_state_grid1"       "us_state_grid2"       "eu_grid1"
 [4] "aus_grid1"            "sa_prov_grid1"        "london_boroughs_grid"
 [7] "nhs_scot_grid"        "india_grid1"          "india_grid2"
[10] "argentina_grid1"      "br_grid1"
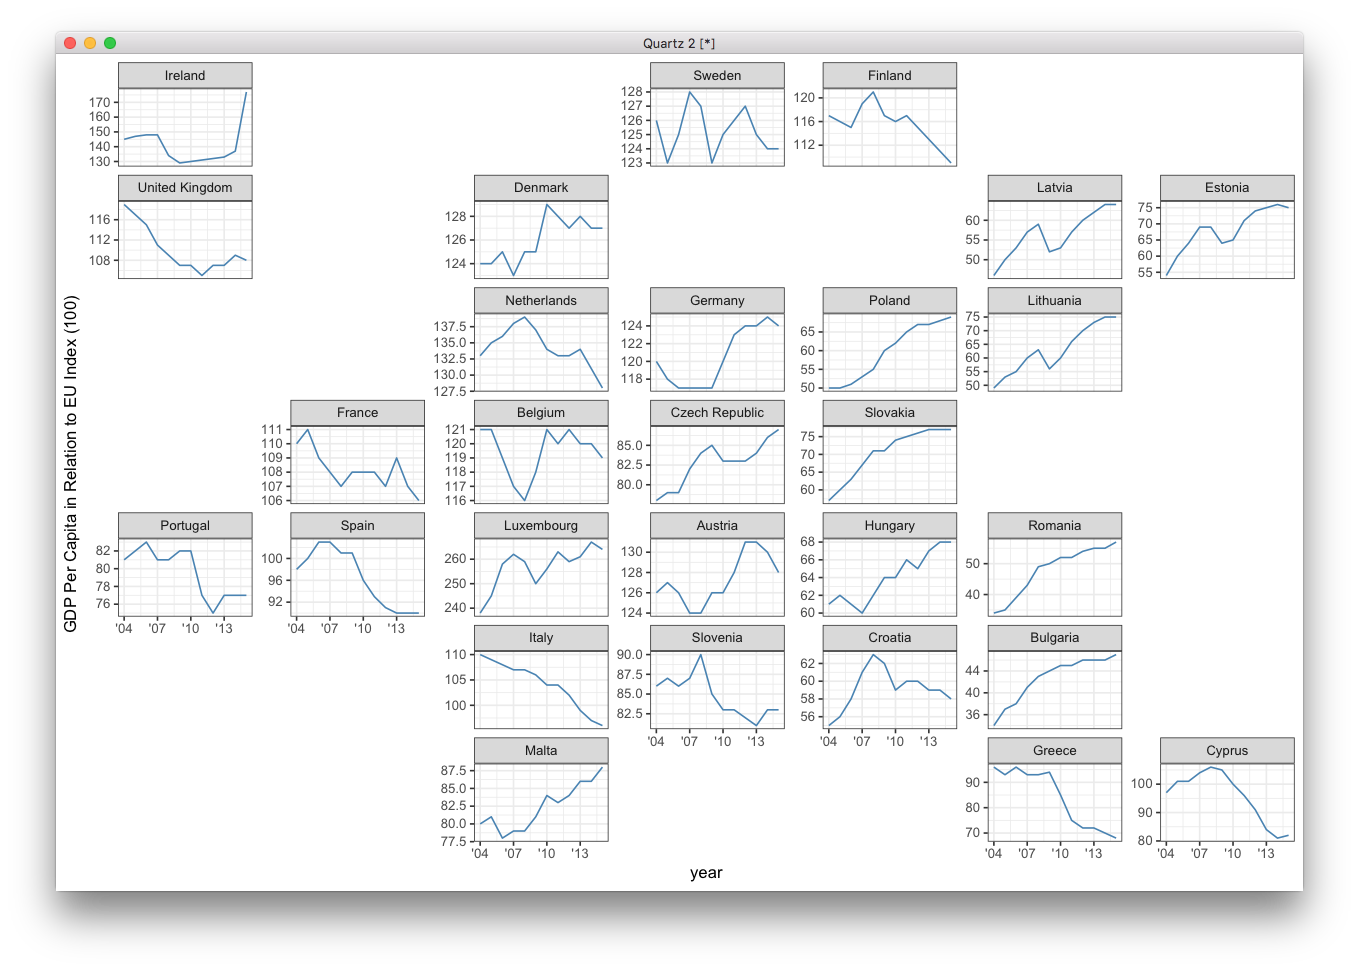
比如我们用欧盟国家的位置来画它们的GDP:
ggplot(eu_gdp, aes(year, gdp_pc)) +
  geom_line(color = "steelblue") +
  facet_geo(~ name, grid = "eu_grid1", scales = "free_y") +
  scale_x_continuous(labels = function(x) paste0("'", substr(x, 3, 4))) +
  ylab("GDP Per Capita in Relation to EU Index (100)") +
  theme_bw()
很可惜,没有中国各个省的位置信息,不过这个分分钟我们可以搞出来,我之前为了画中国地图,打包了个中国的地图信息(分省份,且有台湾)在chinamap包里,我们很容易通过这个data.frame生成一个各个省相对位置的grid表格来,大家可以试一下,或者等我什么时候有这个可视化的需求,我再来搞。

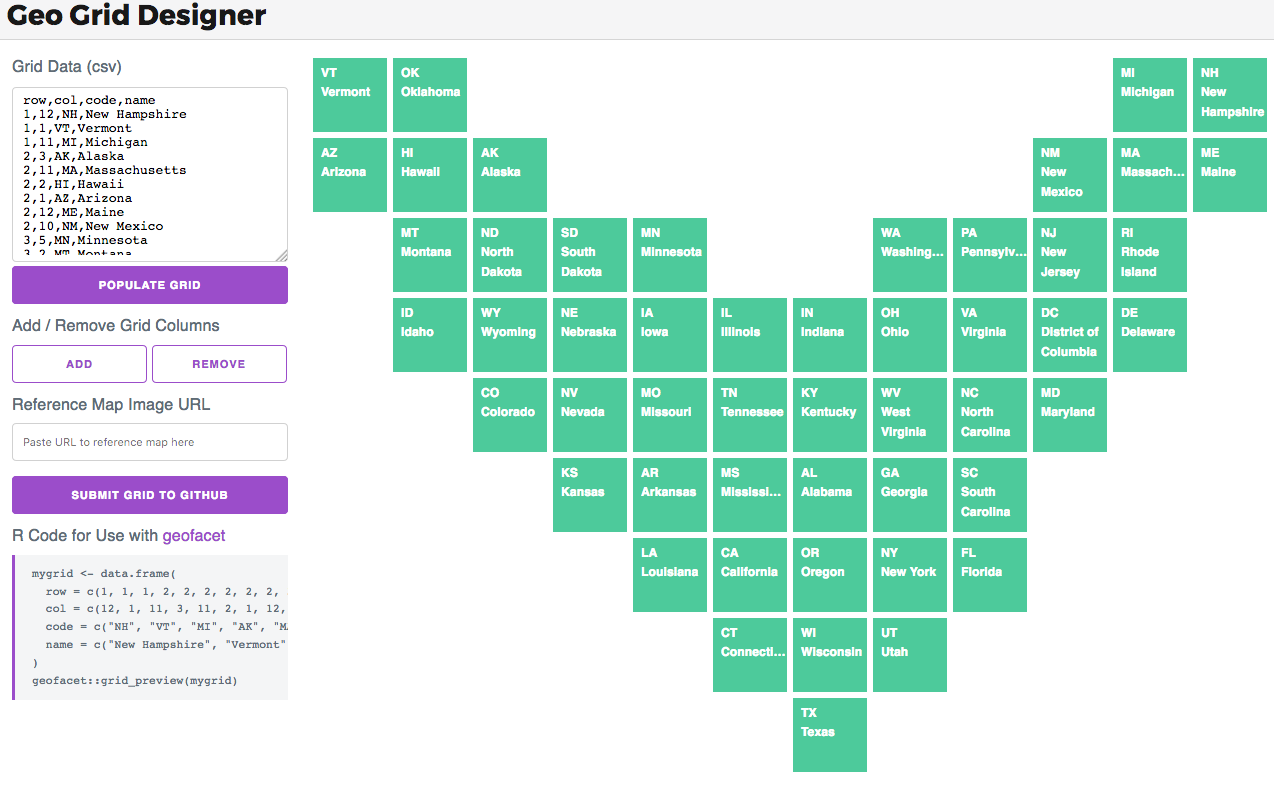
有grid信息之后,geofacet还支持通过拖拽来微调,这是用shiny写的:
grid_design()
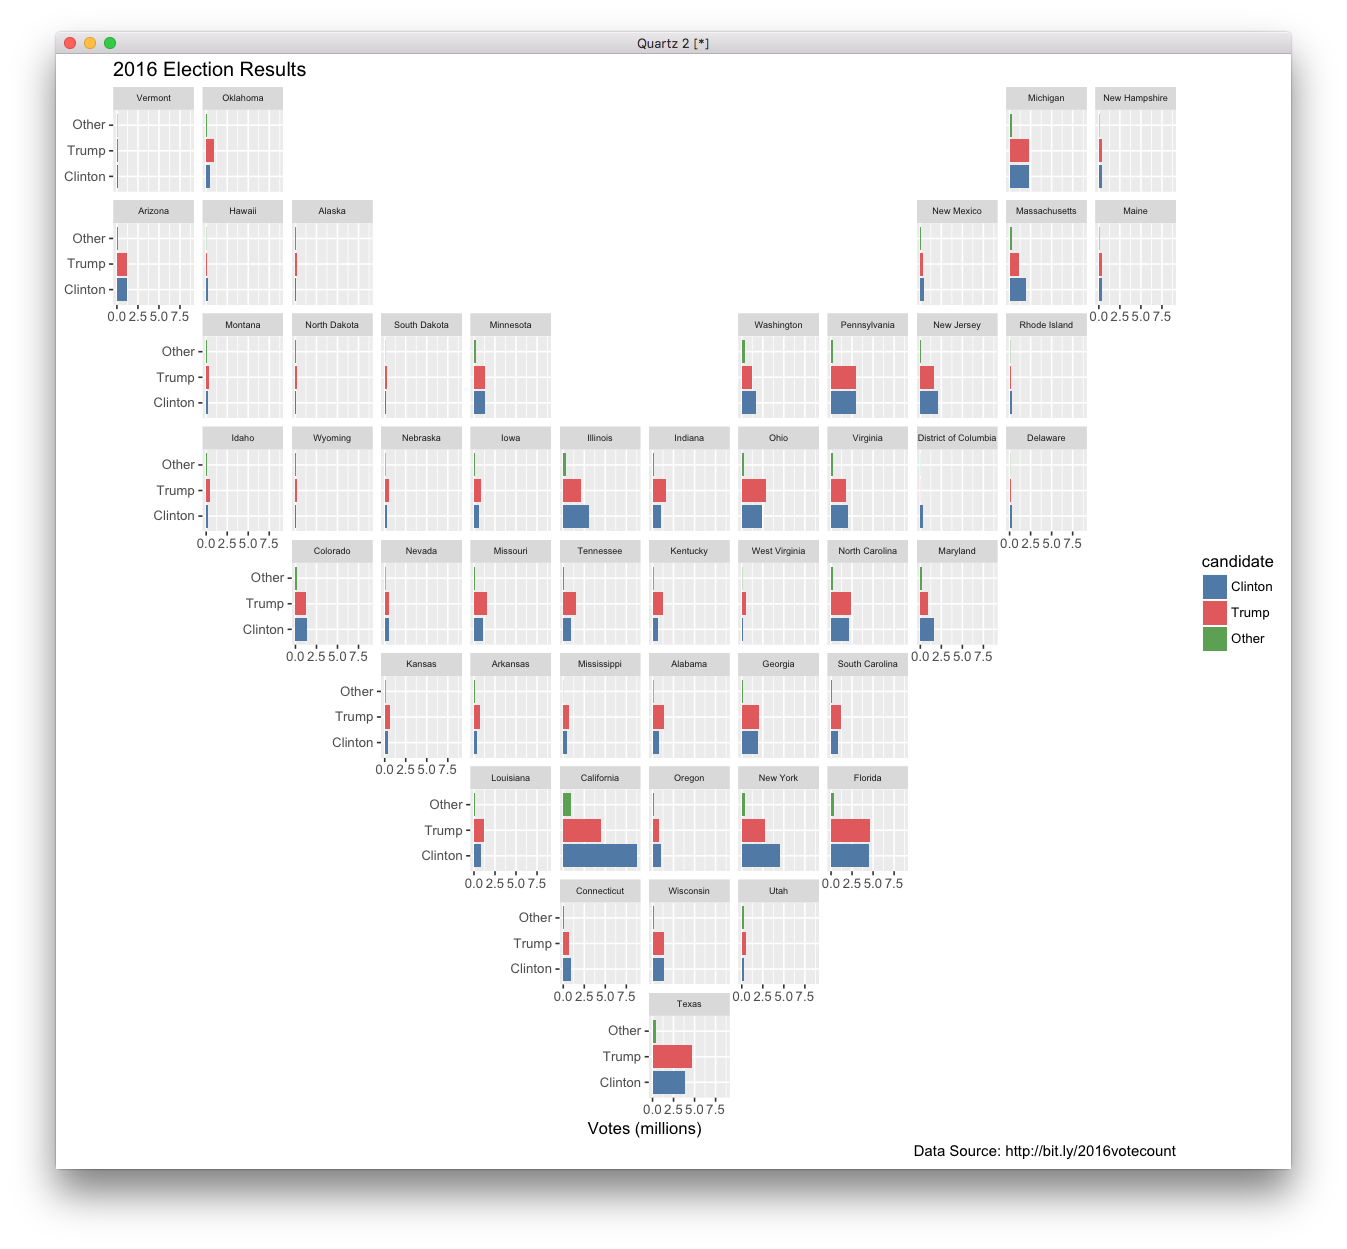
比如我把美国地图拖成这样子:
然后拿它来可视化美国大选:
ggplot(election, aes(candidate, votes / 1000000, fill = candidate)) +
  geom_col() +
  scale_fill_manual(values = c("#4e79a7", "#e15759", "#59a14f")) +
  facet_geo(~ state, grid = mygrid) +
  coord_flip() +
  labs(title = "2016 Election Results",
    caption = "Data Source: http://bit.ly/2016votecount",
    x = NULL,
    y = "Votes (millions)") +
  theme(strip.text.x = element_text(size = 6))