
Phylip is also a widely used tree format, which contains taxa sequences with Newick tree text.
In ggtree, we can use read.phylip() function to parse the file and use ggtree() to visualize the tree.
This is a question from ggtree user. In ape and phytools, it’s easy to label edge using the edgelabels function.
set.seed(1)
tr = rtree(30)
library(ape)
plot(tr, main="ape")
edgelabels()
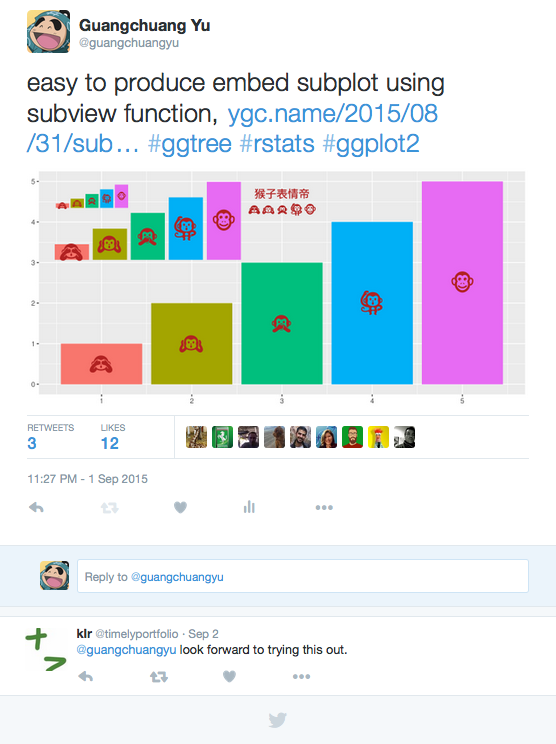
ggtree implemented a function, subview, that can add subplots on a
ggplot2 object. It had successful applied to plot pie graphs on map.
set.seed(2016-01-04)
tr <- rtree(30)
tr <- groupClade(tr, node=45)
p <- ggtree(tr, aes(color=group)) + geom_tippoint()
cpos <- get_clade_position(p, node=45)
p1 <- p + geom_hilight(node=45)
p2 <- with(cpos, p+xlim(xmin, xmax*1.01)+ylim(ymin, ymax))
with(cpos, subview(p2+geom_tiplab(), p1+theme_transparent(), x=xmin+(xmax-xmin)*.15, y=ymin+(ymax-ymin)*.85))
clusterProfiler supports over-representation test and gene set
enrichment analysis of Gene Ontology. It supports GO annotation from
OrgDb object, GMT file and user’s own data.
support many species
In github version of clusterProfiler, enrichGO and gseGO functions
removed the parameter organism and add another parameter OrgDb, so
that any species that have OrgDb object available can be analyzed in
clusterProfiler. Bioconductor have already provide OrgDb for about
20 species, see
http://bioconductor.org/packages/release/BiocViews.html#___OrgDb, and
users can build OrgDb via AnnotationHub.
A new version of ggtree that works with ggplot2 (version >= 2.0.0) is now availabel.
new layers
Some functions, add_legend, hilight, annotation_clade and annotation_clade2 were removed. Instead we provide layer functions, geom_treescale, geom_hilight and geom_cladelabel. You can use + operator to add layers using these layer functions.
In addtion, we provide geom_point2, geom_text2 and geom_segment2 which works exactly as geom_point, geom_text and geom_segment except they allow ggtree users to do subsetting.
I have played with emoji in R for a while. My solution of using it is different from what implemented in emoGG.
emoGG is a good attemp to add emoji in ggplot2. It render emoji picture (png) and creat a layer, geom_emoji, to add emoji.
In my opinion, emoji should be treated as ordinary font in user interface, albeit it maynot be true internally.
It would be more flexible if we can use emoji as ordinary font and in this way user don’t need to learn extra stuff.
