I have 7 packages published within the Bioconductor project.
A new package meshes was included in BioC 3.4 release.

I have 7 packages published within the Bioconductor project.
A new package meshes was included in BioC 3.4 release.
发现Youtube上有一个视频叫Evolution of clusterProfiler, 是Landon Wilkins用Gource做的。于是我也来玩一下,看一下自己这几年码代码的过程。
Today is my birthday and it happened to be the release day of Bioconductor 3.3. It’s again the time to reflect what I’ve done in the past year.
To answer the issue, I extend the covplot function to support viewing coverage of a list of GRanges objects or bed files.
library(ChIPseeker)
files <- getSampleFiles()
peak=GenomicRanges::GRangesList(CBX6=readPeakFile(files[[4]]),
                                CBX7=readPeakFile(files[[5]]))

p <- covplot(peak)
print(p)
In BioC 3.2 release, all my packages including GOSemSim, clusterProfiler, DOSE, ReactomePA, and ChIPseeker switch from Sweave to R Markdown for package vignettes.
To make it consistent between GOSemSim and clusterProfiler, ‘worm’ was deprecated and instead we should use ‘celegans’. As usual, information content data was updated.
ChIP-seq is rapidly becoming a common technique and there are a large number of dataset available in the public domain. Results from individual experiments provide a limited understanding of chromatin interactions, as there is many factors cooperate to regulate transcription. Unlike other tools that designed for single dataset, ChIPseeker is designed for comparing profiles of ChIP-seq datasets at different levels.
We provide functions to compare profiles of peaks binding to TSS regions, annotation, and enriched functional profiles. More importantly, ChIPseeker incorporates statistical testing of co-occurrence of different ChIP-seq datasets and can be used to identify co-factors.
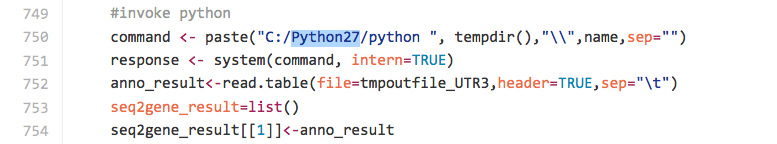
I found a Bioconductor package, seq2pathway, that can apply functional analysis to NGS data. It consists of two components, seq2gene and gene2pathway. seq2gene converts genomic coordination to genes while gene2pathway performs functional analysis at gene level.
I think it would be interesting to incorporate seq2gene with
clusterProfiler. But it fail to run due to it call absolute path of
python installed in the author’s computer.