最近推特上在讨论的一种叫做joyplot的作图方式,如果我们按照正常的画法,这些分布会重叠在一起,不容易看。而这种joyplot,有一种山峰叠峦的即视感:

最近推特上在讨论的一种叫做joyplot的作图方式,如果我们按照正常的画法,这些分布会重叠在一起,不容易看。而这种joyplot,有一种山峰叠峦的即视感:

I just discovered an interesting ggplot2 extension, geofacet, that supports arranging facet panels that mimics geographic topoloty.
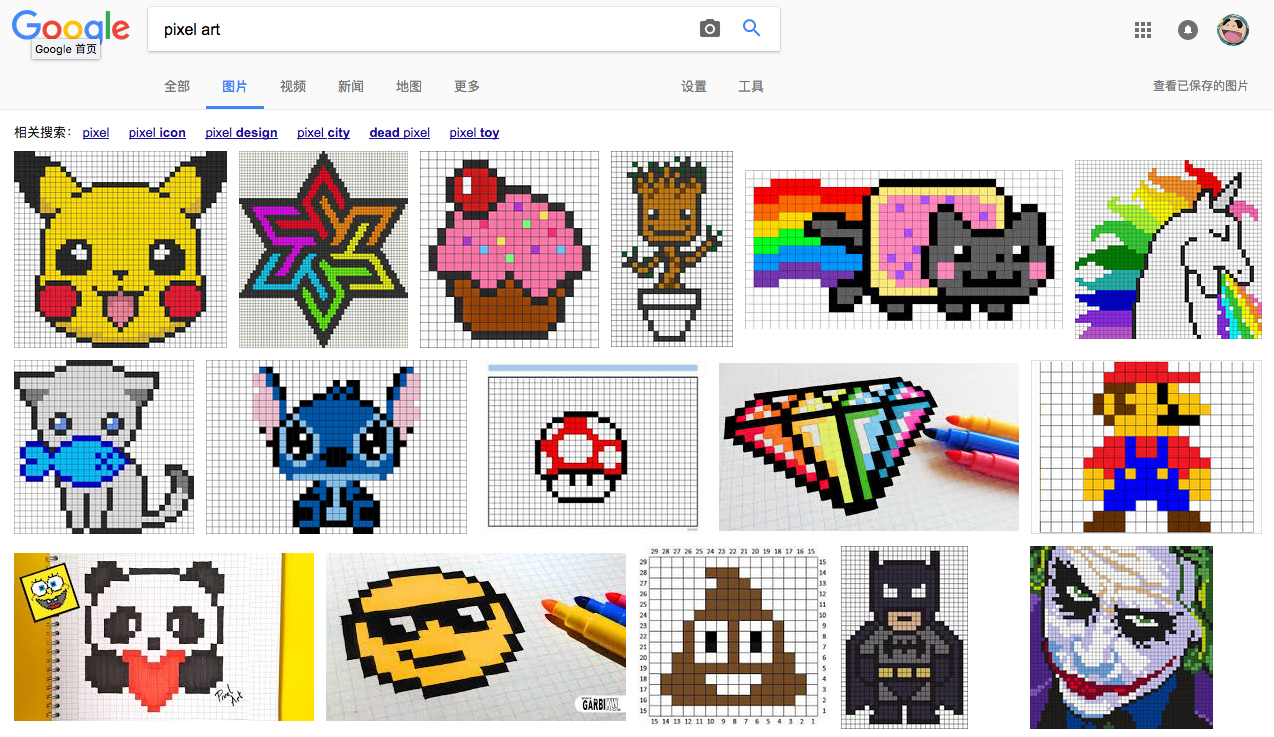
After playing with it, I realized that it is not only for visualizing geo-related data, but also can be fun for presenting data to mimics pixel art.

CRAN刚上线的新包geofacet,可以让ggplot2分面按指定的地理位置来,比如下面的数据,美国各州各项指标的排名:
  head(state_ranks)
    state   name   variable rank
1    AK Alaska  education   28
2    AK Alaska employment   50
3    AK Alaska     health   25
4    AK Alaska     wealth    5
5    AK Alaska      sleep   27
6    AK Alaska    insured   50
我们正常画图是这样子的:
With ggtree (Yu et al. 2017), it is very easy to create phylomoji. Emoji is internally supported by ggtree.
library(ggtree)
tree_text <- "(((((cow, (whale, dolphin)), (pig2, boar)), camel), fish), seedling);"
x <- read.tree(text=tree_text)
ggtree(x, linetype="dashed", color='firebrick') +
    xlim(NA, 7) + ylim(NA, 8.5) +
    geom_tiplab(aes(color=label), parse='emoji', size=14, vjust=0.25) +
    labs(title="phylomoji", caption="powered by ggtree + emojifont")

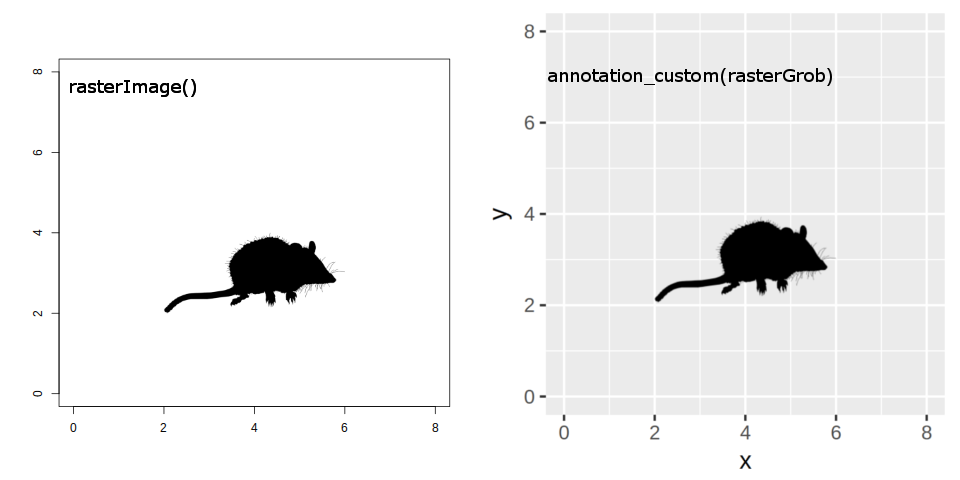
本文介绍了ggimage包,允许在ggplot2作图时嵌入图片,并支持aes映射,可以把离散型变量映射到不同图片。目前有几个包可以使用图片嵌入做图,但都是针对特定的场景,这里使用ggimage来展示在这些特定领域里的应用,ggimage的设计是通用的,并不被特定场景所限定,文末又介绍了用R图标来画出R、用饼图来画气泡图等实例。
R 基础图形库(base graphics)可以在做图的时候嵌入图片,使用的是graphics::rasterImage:
imgurl <- "http://phylopic.org/assets/images/submissions/295cd9f7-eef2-441e-ba7e-40c772ca7611.256.png"
library(EBImage)
x <- readImage(imgurl)
plot(1, type = "n", xlab = "", ylab = "", xlim = c(0, 8), ylim = c(0, 8))
rasterImage(x, 2, 2, 6, 4)

比如下面的代码:
require(ggplot2)
d <- data.frame(x=c(0, 0.002, 0.00575), y = 1:3)
p <- ggplot(d, aes(x, y)) + geom_point() + xlab(NULL) + ylab(NULL)
print(p)

上面图中x轴的文本0.006,这个数字中的6几乎看不到,因为一半过界了。
面向对象有多种实现方式,R里面就有3种,class-based, method-based, object-based,R6与C++/JAVA一样是class-based的,S3/S4是method-based的,还有一种是object-based的,这在proto包中实现,很多人可能没听说过,但是ggplot2你们一定听过,ggplot2就是object-based的实现,它现在是自己的定制实现,称之为ggproto。
emojifont就是用proto实现的,属于我的练手之作,很高兴深受大家的喜欢。