Bonus! - Phylogenetic tree with images
We usually use text to label taxa, i.e. displaying taxa names. If the text is image file name (either local or remote), ggtree can read the image and display the actual image as label of the taxa. The geom_tiplab and geom_nodelab are capable to render silhouette image by internally called ggimage package.
library(ggimage)
library(ggtree)

nwk <- "((((bufonidae, dendrobatidae), ceratophryidae), (centrolenidae, leptodactylidae)), hylidae);"

x = read.tree(text = nwk)
ggtree(x) + xlim(NA, 7) + ylim(NA, 6.2) +
    geom_tiplab(aes(image=paste0("img/frogs/", label, '.jpg')),
                geom="image", offset=2, align=2, size=.2)  +
    geom_tiplab(geom='label', offset=1, hjust=.5) +
    geom_image(x=.8, y=5.5, image="img/frogs/frog.jpg", size=.2)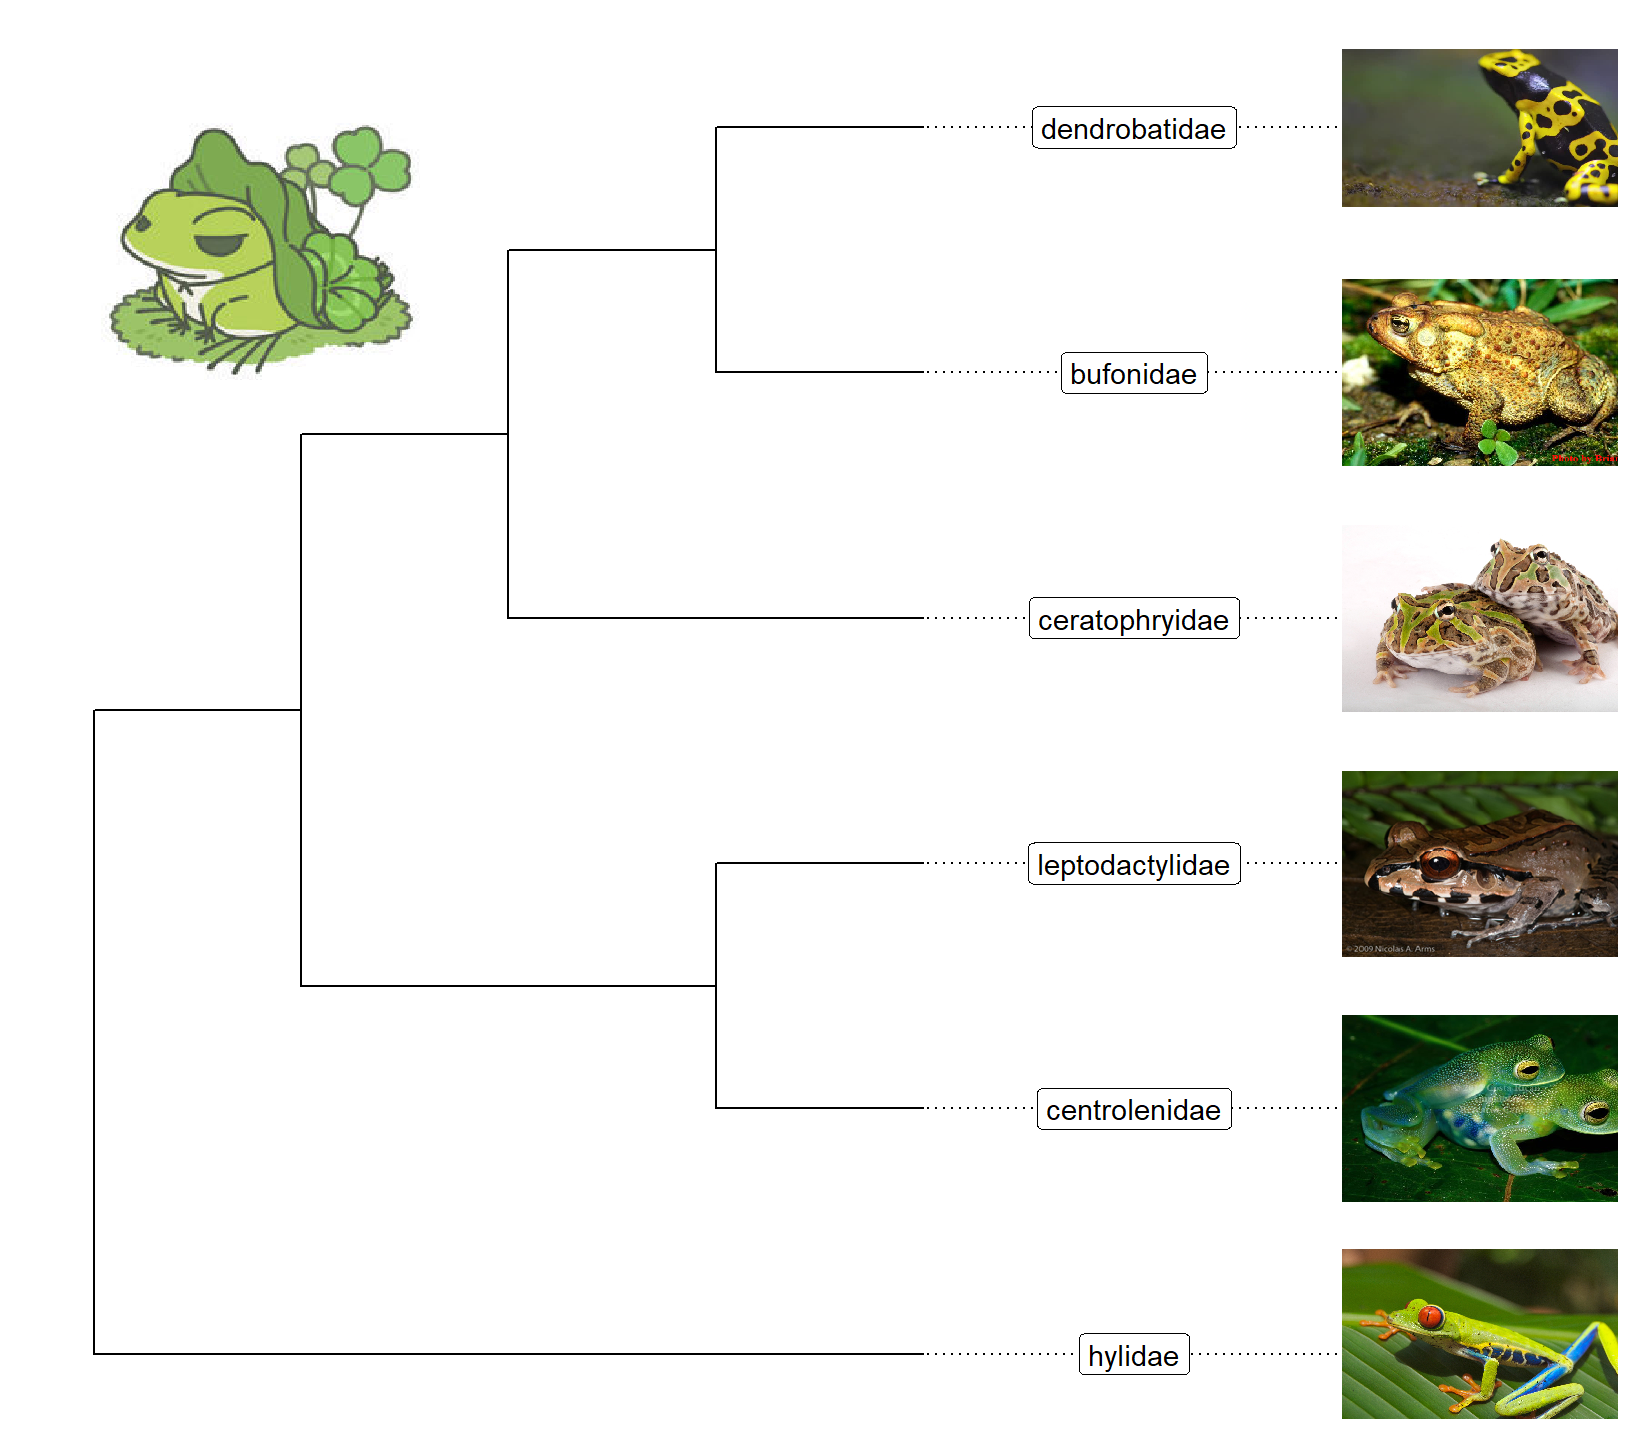
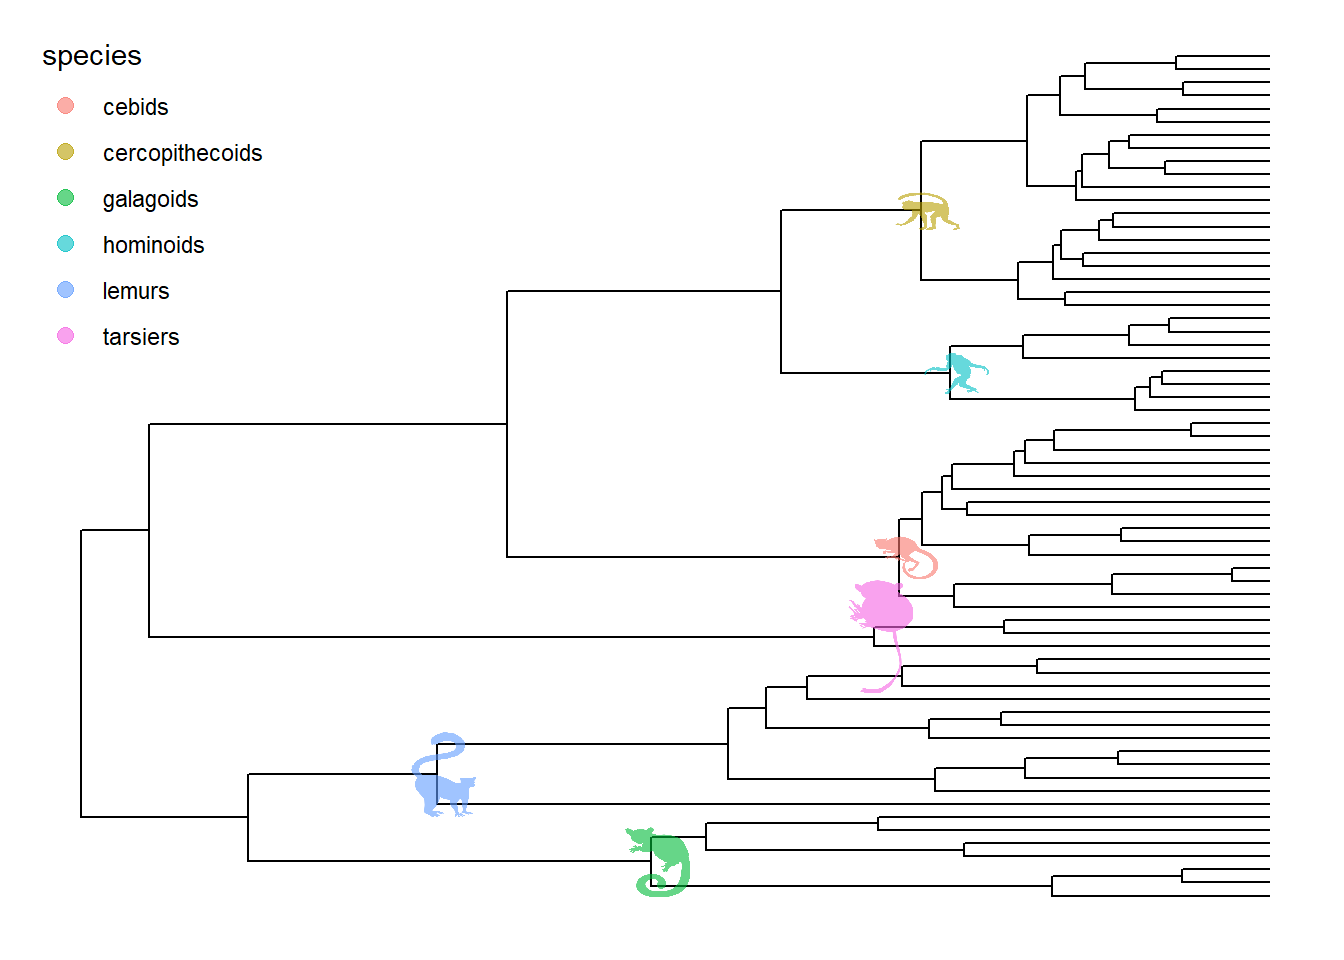
Phylopic contains more than 3200 silhouettes and covers almost all life forms. ggtree also supports using phylopic to annotate the tree. Most importantly, we can color the image using numerical/categorical variable.
tree <- ape::read.nexus("https://raw.githubusercontent.com/rgriff23/Dissertation/master/Chapter_2/data/tree.nex")
phylopic_info <- data.frame(node = c(124, 113, 110, 96, 89, 70),
                            phylopic = c("c4ac9ea6-b465-4ed0-a5de-9fe4eebd3ef9",
                                        "5388a472-994a-48e1-86de-d988c6019e72",
                                        "615c82cf-fabe-49f8-b571-e8117edfa212",
                                        "63ff1b70-6b6e-4412-b4d2-b2e2fb51aa95",
                                        "d65d5abd-df8b-4509-912c-e42f6c34861f",
                                        "6d54acc7-9e1e-4b79-be88-4904cf58fbb5"),
                            species = c("galagoids", "lemurs", "tarsiers",
                                        "cebids", "hominoids", "cercopithecoids"))
pg <- ggtree(tree)
pg %<+% phylopic_info +
  geom_nodelab(aes(image=phylopic, color=species, subset=!is.na(species)),
              geom="phylopic", alpha = .6) +
  theme(legend.position=c(.1, .8))