I have been using clusterProfiler, which is a very useful package for gene set analysis and visualisation. I would like to use the ‘cnetplot’ function to plot a network of GO terms and the related genes. However for larger networks, the automatic display can be confusing and it would be helpful to be able to move nodes around. In the past I could do this with with cnetplot(fixed=FALSE) option, but after updating R and re-installing clusterProfiler, the output remains static.

I am using R 3.5.3 with clusterProfiler v3.10.1 which I installed using Bioconductor 3.8. I have installed and loaded the ‘igraph’ package, and the following test code produces output in an interactive window, as desired:

library(igraph) g <- make_ring(10) tkplot(g)

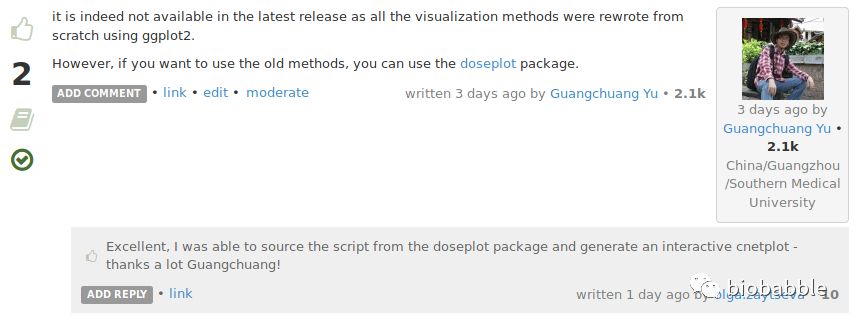
Is there any way to make cnetplot output interactive, or is that functionality simply not available in the latest release?

Any help would be greatly appreciated!

Continue reading

让我们画个黑板报吧

上次推送的《geom_bgimage》,竟然有人问说用ggplot2怎么搞。明明我的例子就是了,虽然用的是ggtree的例子,但与ggplot2何异?

require(ggplot2)
require(ggimage)

d = data.frame(x=LETTERS[1:3], y = 1:3)
d$y2 = rev(cumsum(rev(d$y)))

p = ggplot(d, aes(x=1, y, fill=x)) + geom_col(color='white') +  
 geom_bgimage("img/blackboard.jpg") + theme_void() +
 coord_polar("y") + theme(legend.position='none') + 
 geom_text(aes(y = y2 - y/2, label=x),family='xkcd', size=8) + 
 xlim(-1, NA) + scale_fill_viridis_d()

Continue reading

画图给点分组?》这一篇文章中给出了方法,画出两层分组的点图,一层分组是按照离散型变量在x轴上分组,第二层是每一个分组里,再来一个离散型变量再分一次。非常感谢读者们的反馈,原来这第二层分组在ggplot2中是有内置的实现方式的,那就是position_jitterdodge

Continue reading

有一个叫CellMarker的数据库,专门收录组织和细胞的基因标记物,收录还比较全,而且是手工校对的(可怜一下干这种脏活的研究生三秒钟)。

By manually curating over 100 000 published papers, 4124 entries including the cell marker information, tissue type, cell type, cancer information and source, were recorded. At last, 13 605 cell markers of 467 cell types in 158 human tissues/sub-tissues and 9148 cell makers of 389 cell types in 81 mouse tissues/sub-tissues were collected and deposited in CellMarker.

Continue reading

群里大家给出各种解法,但似乎避开了dplyr之后,大家还是会用到plyr或者purrr,没人给出我讲的apply套split的纯base R的解法。

套两重for循环,会让人容易理解一点,而且代码也非常简单,但效率不行,用apply的话,处理各种list,特别如果要list套list,很多人就比较懵逼,需要借助于plyr或purrr,甚至还有人的解法虽然不用dplyr的group_by套summarise,但用了dplyr其它的函数。tidyverse真的太好用,对低端R用户照顾得太好,大家都被惯坏了,但想一下,以前的人真的就不用活了吗?

Continue reading

Author's picture

Guangchuang Yu

Bioinformatics Professor @ SMU

Bioinformatics Professor

Guangzhou