
add layer to specific panel of facet_plot output
This is a question from ggtree google group:
Dear ggtree team,
how can I apply a geom_xxx to only one facet panel? For example if i want to get
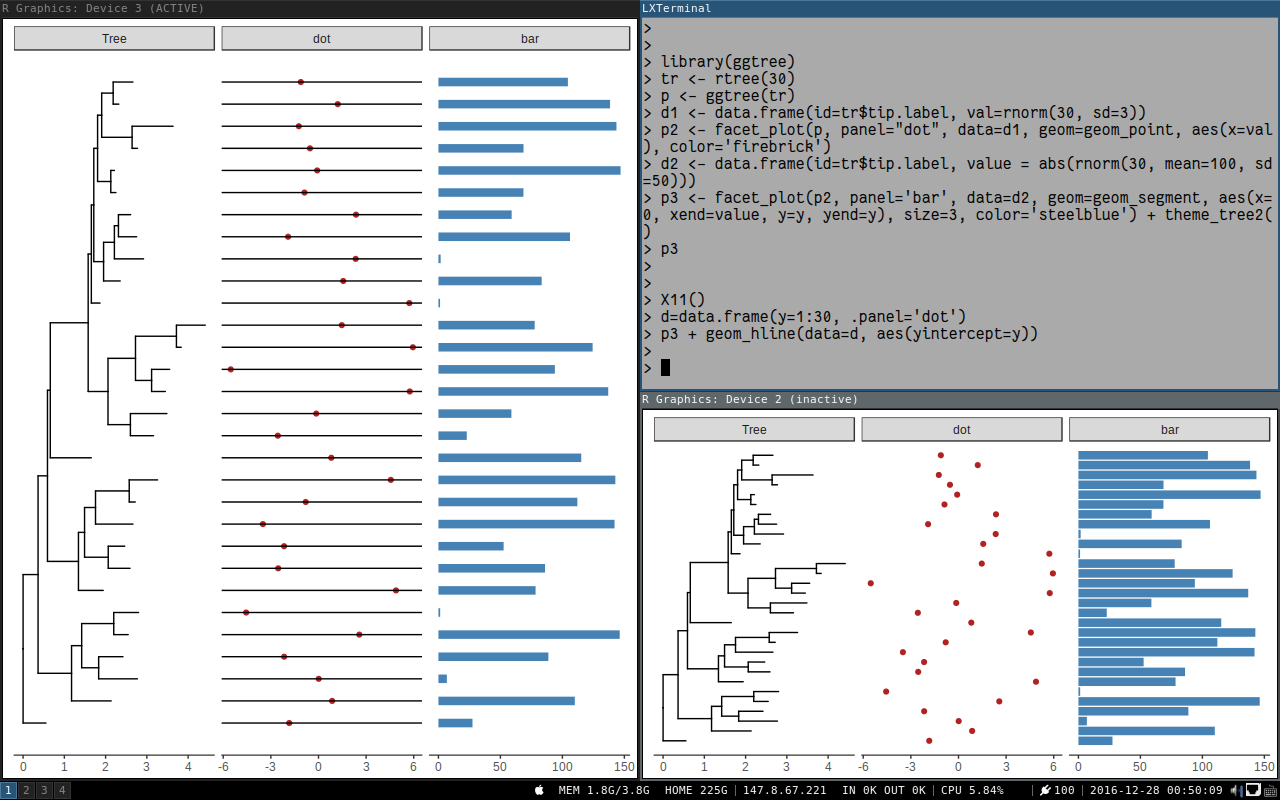
geom_hline(yintersect=1:30)or ageom_text()in the dot panel? I cant see thefacet_grid(. ~ var)function call, so I don’t know which subsetting to use. I have already read http://stackoverflow.com/questions/29873155/geom-text-and-facets-not-workingtr <- rtree(30) d1 <- data.frame(id=tr$tip.label, val=rnorm(30, sd=3)) p <- ggtree(tr) p2 <- facet_plot(p, panel="dot", data=d1, geom=geom_point, aes(x=val), color='firebrick') d2 <- data.frame(id=tr$tip.label, value = abs(rnorm(30, mean=100, sd=50))) p3 <- facet_plot(p2, panel='bar', data=d2, geom=geom_segment, aes(x=0, xend=value, y=y, yend=y), size=3, color='steelblue') + theme_tree2()Thanks! Andreas
If this can be done, we can create even more comprehensive tree plots.
In fact, it’s quite easy to do. In facet_plot, ggtree used a variable .panel to store the panel information. We can add a dummy column .panel to our data and pass it to geom layer function and the layer will be added to selected panel we specify in the .panel column.
To follow up the above example, we can create a data.frame that contains y and .panel="dot" as we want to add horizontal lines in dot panel.
d=data.frame(y=1:30, .panel='dot')
p3 + geom_hline(data=d, aes(yintercept=y))
Here is what we can get:
The xlim_expand is actually adding a geom_blank layer to selected panel for setting x-axis limits of that panel.
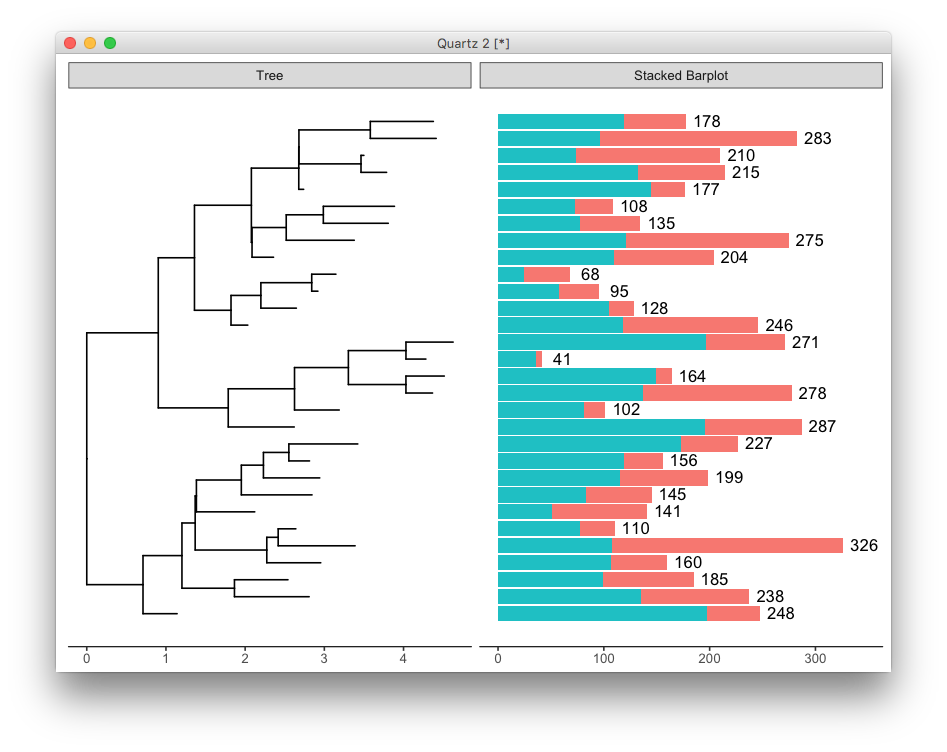
Another approach is using facet_plot with panel parameter setting to existing one.
An example is posted in google group:
library(dplyr)
library(ggstance)
library(ggtree)

tr <- rtree(30)
p <- ggtree(tr) + theme_tree2()

df <- data.frame(id = rep(tr$tip.label, each=2),
                 value = abs(rnorm(60, mean=100, sd=50)),
                 category = rep(LETTERS[1:2], 30))

sum_value <- df %>%
    group_by(id) %>%
    summarize(total = sum(value))

p2 <- facet_plot(p, panel = 'Stacked Barplot',
                 data = df, geom = geom_barh,
                 mapping = aes(x = value, fill = as.factor(category)),
                 stat='identity' )

facet_plot(p2, panel='Stacked Barplot',
           data=sum_value, geom=geom_text,
           mapping=aes(x=total+20, label=round(total)))
Citation
G Yu, DK Smith, H Zhu, Y Guan, TTY Lam*. ggtree: an R package for visualization and annotation of phylogenetic trees with their covariates and other associated data. Methods in Ecology and Evolution. doi:10.1111/2041-210X.12628.
