dotplot for GSEA result

For GSEA analysis, we are familar with the above figure which shows the running enrichment score. But for most of the software, it lack of visualization method to summarize the whole enrichment result.

In DOSE (and related tools including clusterProfiler, ReactomePA and meshes), we provide enrichMap and cnetplot to summarize GSEA result.

Continue reading

This is a question from ggtree google group:

Dear ggtree team,

how can I apply a geom_xxx to only one facet panel? For example if i want to get geom_hline(yintersect=1:30) or a geom_text() in the dot panel? I cant see the facet_grid(. ~ var) function call, so I don’t know which subsetting to use. I have already read http://stackoverflow.com/questions/29873155/geom-text-and-facets-not-working

  tr <- rtree(30)
  
  d1 <- data.frame(id=tr$tip.label, val=rnorm(30, sd=3))
  p <- ggtree(tr)
  
  p2 <- facet_plot(p, panel="dot", data=d1, geom=geom_point, aes(x=val), color='firebrick')
  d2 <- data.frame(id=tr$tip.label, value = abs(rnorm(30, mean=100, sd=50)))
  
  p3 <- facet_plot(p2, panel='bar', data=d2, geom=geom_segment, aes(x=0, xend=value, y=y, yend=y), size=3, color='steelblue') + theme_tree2()

Thanks! Andreas

If this can be done, we can create even more comprehensive tree plots.

Continue reading

Edge coloring with user data

Coloring edges in ggtree is quite easy, as we can map the color to numerical or categorical values via the aes(color=VAR) syntax. For user’s own data, it is also easy as ggtree provide the %<+% operator to attach user data.

But as it seems not so obviously for ggtree users, see question 1, 2, and 3, I will demonstrate how to color edges using user data here.

Continue reading

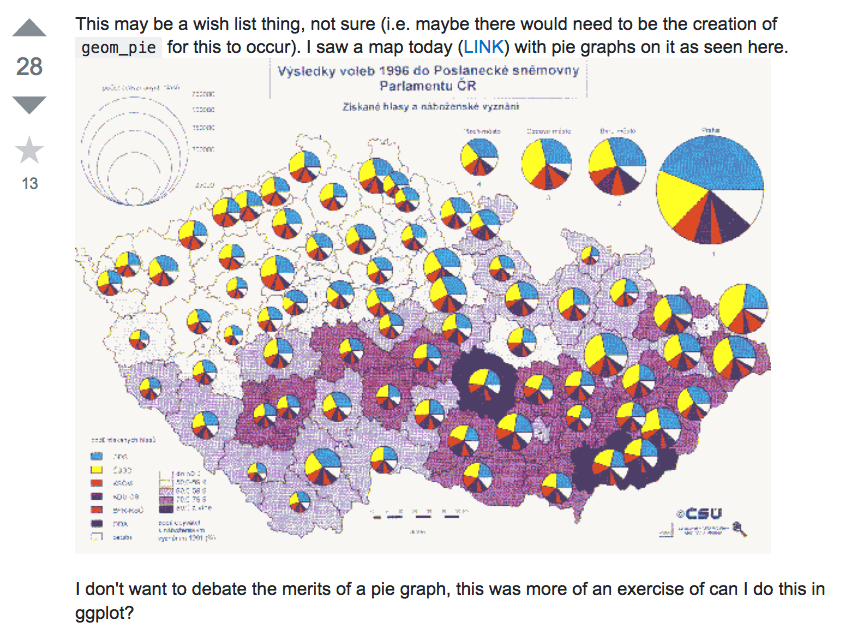
Plotting pies on ggplot/ggmap is not an easy task, as ggplot2 doesn’t provide native pie geom. The pie we produced in ggplot2 is actually a barplot transform to polar coordination. This make it difficult if we want to produce a map like the above screenshot, which was posted by Tyler Rinker, the author of R package pacman.

Continue reading

Hi,

I know this question has been asked before a long time ago and I don’t see an answer of that question in the mailing list or in the vignette of GOsemsim package. So I was wondering what is the easiest possible way of calculating GO semantic similarity value for orthologus gene pairs between two species using the above R package or any other package you know of. I am not doing this for less annotated species I need to calculate that for orthologus genes between Human and Mouse (both of which are well annotated IMHO). So I would much appreciate it if anyone who has already done this before can point me to a resource which already has pre-calculated semantic similarity values for Mouse and Human orthologues or has inbuilt code to do that.

Thanks & regards

这是Bioconductor support site上的问题,问的是他想要计算人类和老鼠的直系同源基因通过GO注释来计算语义相似性,问GOSemSim是否支持,这个答案是yes and no。

Continue reading

Author's picture

Guangchuang Yu

Bioinformatics Professor @ SMU

Bioinformatics Professor

Guangzhou