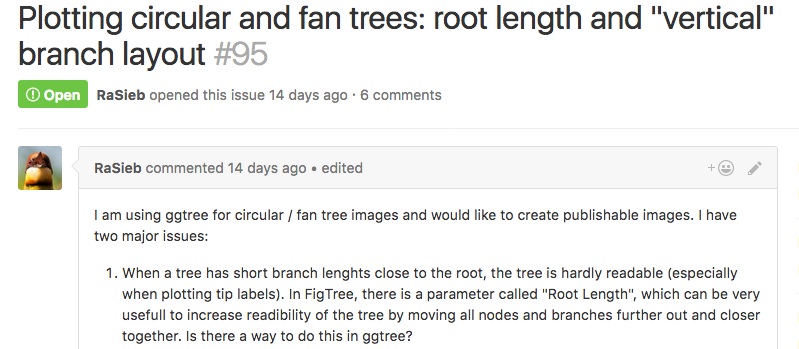
这是github上的问题,他想画环形树的时候,加一条长长的root length把tips给顶出去。
这个问题在google forum上我早已解答:

https://twitter.com/kurai_yousei/status/799532564633518080

这个Diego在推特上问的问题,他最近在写一个motiftools的R包,里面用了ggtree来画图,我想他应该是要解决他在包里的画树/聚类功能吧。
他问题写的horizontal,但其实plot.hclust默认是vertical,ggtree默认也是horizontal,所以我认为他问的是vertical layout,这个在我的回答中也得到了他的确认。
A question on biostars asking how to generate the following figure:
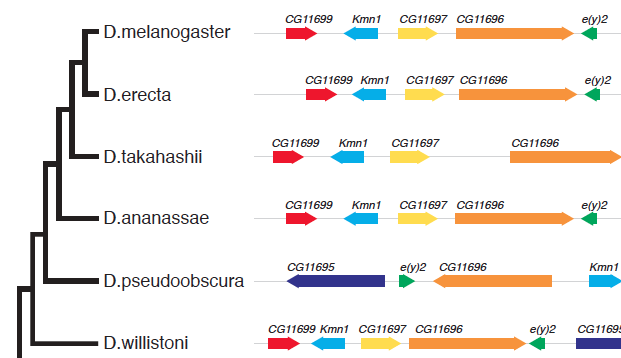
This can be quite easy to implement in ggtree, I can write a geom layer to layout the alignment. As ggbio already provides many geom for genomic data and I don’t want to re-invent the wheel, I decided to try ggtree+ggbio. This is also the beauty of R that packages complete each others.
这是最近github上的问题,如何反转time scale,也就是把最近的时间设为0。而内部节点为距今多少年,这个很容易,把x轴的值变成x-max(x)就可以,感觉这个也只会在时间树上使用,所以取名revts(reverse time scale),revts之后,x轴最大值是0,其它为负数,可以使用scale_x_continuous改label为绝对值。
A ggtree user recently asked me the following question in google group:
I try to plot long tip labels in ggtree and usually adjust them using xlim(), however when creating a facet_plot xlim affects all plots and minimizes them.
Is it possible to work around this and only affect the tree and it’s tip labels leaving the other plots in facet_plot unaffected?
This is indeed a desire feature, as ggplot2 can’t automatically adjust xlim for text since the units are in two different spaces (data and pixel).
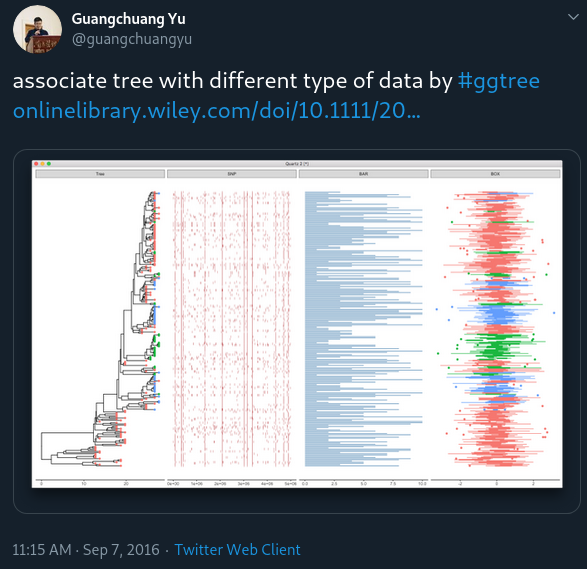
ggtree provides gheatmap for visualizing heatmap and msaplot for visualizing multiple sequence alignment with phylogenetic tree.
We may have different data types and want to visualize and align them with the tree. For example, dotplot of SNP site (e.g. using geom_point(shape='|')), barplot of trait values (e.g. using geom_barh(stat='identity')) et al.
To make it easy to associate different types of data with phylogenetic tree, I implemented the facet_plot function which accepts a geom function to draw the input data.frame and display it in an additional panel.
I have 7 packages published within the Bioconductor project.
A new package meshes was included in BioC 3.4 release.
