最新的一个问题,大致讲他有两个trait, A和B,想拿A来给label上色,B来画热图。
加载用户数据我们有%<+%操作符,热图有gheatmap函数。
我给了他一个简单的例子:


最新的一个问题,大致讲他有两个trait, A和B,想拿A来给label上色,B来画热图。
加载用户数据我们有%<+%操作符,热图有gheatmap函数。
我给了他一个简单的例子:
比如下面的代码:
require(ggplot2)
d <- data.frame(x=c(0, 0.002, 0.00575), y = 1:3)
p <- ggplot(d, aes(x, y)) + geom_point() + xlab(NULL) + ylab(NULL)
print(p)
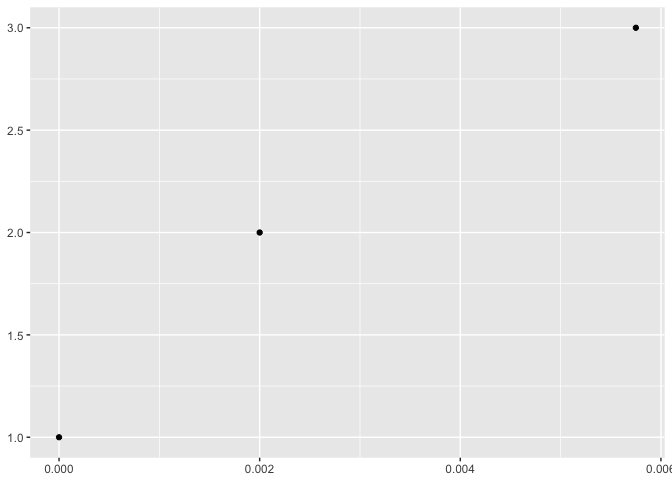
上面图中x轴的文本0.006,这个数字中的6几乎看不到,因为一半过界了。
MEE在18号出版了今年(第8卷)第1期,ggtree正好在这一期出版,一经出版就有几条推在传播, 我也是在推特上看到,才发现,哦原来我的文章出版了。然后我又发现2017年新鲜出炉有了一篇PNAS的引用。
我以前没接触过进化,来了现在这个实验室,发现可视化是个大问题,大家都在用AI,慢慢地抠,对于一些和进化树相关的数据,自己一点一点地在AI里面加上去。甚至于genotype table是一个框一个框地在AI里面加的。一方面画一顆树可能用掉你几天的时间,另一方面,太容易出错了,再者你花的时间并不能转化为生产力,每一次你都要这么搞!这简直就是水深火热啊!
我也帮师兄写过一些代码,给定进化树上节点的序列,我比较父节点和子节点,把碱基或氨基酸替换写到newick树的node label,然后就可以用软件展示序列的替换情况。教会了师兄,他再去给他的师弟师妹们演示,说以后咱们可以这么干了,一个个觉得很牛逼,我内心想的是,愚蠢的人类啊,node label只能存一个信息,牛逼的方式应该是可以展示多个维度的信息,通过图层自由组合。这个时候我就产生了要写ggtree的想法。
I have splitted ggtree to 2 packages, treeio and ggtree. Now ggtree is mainly focus on visualization and annotation, while treeio focus on parsing and exporting tree files. Here is a welcome message from treeio that you can convert ggtree output to tree object which can be exported as newick or nexus file if you want.
Thanks to ggplot2, output of ggtree is actually a ggplot object. The ggtree object can be rendered as graph by print method, but internally it is an object that contains data. treeio defines as.phylo and as.treedata to convert ggtree object to phylo or treedata object.
This is a question from ggtree google group:
Dear ggtree team,
how can I apply a geom_xxx to only one facet panel? For example if i want to get
geom_hline(yintersect=1:30)or ageom_text()in the dot panel? I cant see thefacet_grid(. ~ var)function call, so I don’t know which subsetting to use. I have already read http://stackoverflow.com/questions/29873155/geom-text-and-facets-not-workingtr <- rtree(30) d1 <- data.frame(id=tr$tip.label, val=rnorm(30, sd=3)) p <- ggtree(tr) p2 <- facet_plot(p, panel="dot", data=d1, geom=geom_point, aes(x=val), color='firebrick') d2 <- data.frame(id=tr$tip.label, value = abs(rnorm(30, mean=100, sd=50))) p3 <- facet_plot(p2, panel='bar', data=d2, geom=geom_segment, aes(x=0, xend=value, y=y, yend=y), size=3, color='steelblue') + theme_tree2()Thanks! Andreas
If this can be done, we can create even more comprehensive tree plots.
PLOTTING TREES + DATA is difficult. @DrKatHolt developed plotTree (R and Python scripts) to visualize associated data with trees, e.g. heatmap, horizontal bar etc.
I reproduced the examples presented in the plotTree repo using ggtree. Source code is freely available in https://github.com/GuangchuangYu/plotTree-ggtree.
Here are the outputs produced by ggtree:
Coloring edges in ggtree is quite easy, as we can map the color to numerical or categorical values via the aes(color=VAR) syntax. For user’s own data, it is also easy as ggtree provide the %<+% operator to attach user data.
But as it seems not so obviously for ggtree users, see question 1, 2, and 3, I will demonstrate how to color edges using user data here.
