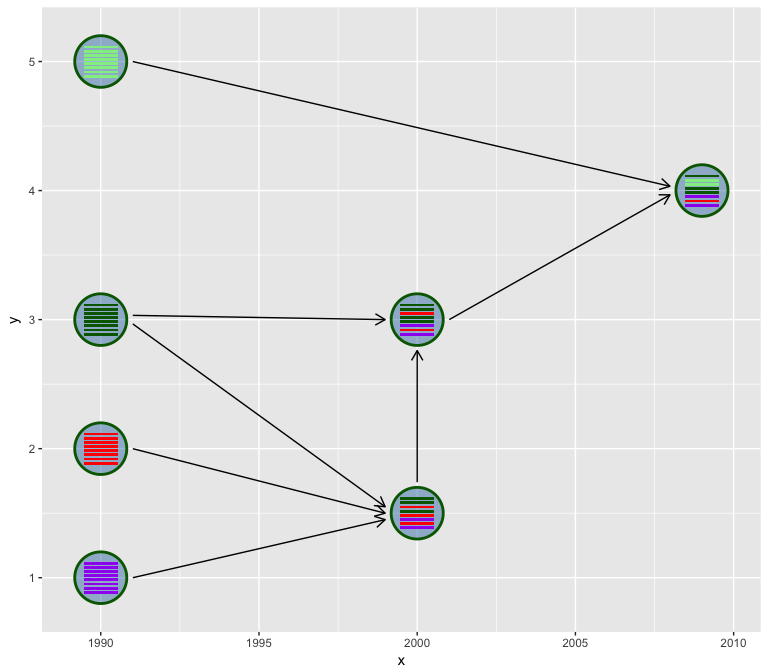
Reassortment is an important strategy for influenza A viruses to introduce a HA subtype that is new to human populations, which creates the possibilities of pandemic.

A diagram showed above (Figure 2 of doi:10.1038/srep25549) is widely used to illustrate the reassortment events. While such diagrams are mostly manually draw and edit without software tool to automatically generate. Here, I implemented the hybrid_plot function for producing publication quality figure of reassortment events.

library(tibble)
library(ggplot2)


n <- 8

virus_info <- tibble(
    id = 1:7,
    x = c(rep(1990, 4), rep(2000, 2), 2009),
    y = c(1,2,3,5, 1.5, 3, 4),
    segment_color = list(
        rep('purple', n),
        rep('red', n),
        rep('darkgreen', n),
        rep('lightgreen', n),
        c('darkgreen', 'darkgreen', 'red', 'darkgreen', 'red', 'purple', 'red', 'purple'),
        c('darkgreen', 'darkgreen', 'red', 'darkgreen', 'darkgreen', 'purple', 'red', 'purple'),
        c('darkgreen', 'lightgreen', 'lightgreen', 'darkgreen', 'darkgreen', 'purple', 'red', 'purple'))
)

flow_info <- tibble(from = c(1,2,3,3,4,5,6),
                    to = c(5,5,5,6,7,6,7))
hybrid_plot(virus_info, flow_info)

Continue reading

ChIP-seq is rapidly becoming a common technique and there are a large number of dataset available in the public domain. Results from individual experiments provide a limited understanding of chromatin interactions, as there is many factors cooperate to regulate transcription. Unlike other tools that designed for single dataset, ChIPseeker is designed for comparing profiles of ChIP-seq datasets at different levels.

We provide functions to compare profiles of peaks binding to TSS regions, annotation, and enriched functional profiles. More importantly, ChIPseeker incorporates statistical testing of co-occurrence of different ChIP-seq datasets and can be used to identify co-factors.

Continue reading

I found a Bioconductor package, seq2pathway, that can apply functional analysis to NGS data. It consists of two components, seq2gene and gene2pathway. seq2gene converts genomic coordination to genes while gene2pathway performs functional analysis at gene level.

I think it would be interesting to incorporate seq2gene with clusterProfiler. But it fail to run due to it call absolute path of python installed in the author’s computer.

Continue reading

Nearest gene annotation

Almost all annotation software calculate the distance of a peak to the nearest TSS and assign the peak to that gene. This can be misleading, as binding sites might be located between two start sites of different genes or hit different genes which have the same TSS location in the genome.

The function annotatePeak provides option to assign genes with a max distance cutoff and all genes within this distance were reported for each peak.

Continue reading

After two weeks developed, I have added/updated some plot functions in ChIPseeker (version >=1.0.1).

ChIP peaks over Chromosomes

> files=getSampleFiles()
> peak=readPeakFile(files[[4]])
> peak
GRanges object with 1331 ranges and 2 metadata columns:
         seqnames                 ranges strand   |             V4        V5
                               |        
     [1]     chr1     [ 815092,  817883]      *   |    MACS_peak_1    295.76
     [2]     chr1     [1243287, 1244338]      *   |    MACS_peak_2     63.19
     [3]     chr1     [2979976, 2981228]      *   |    MACS_peak_3    100.16
     [4]     chr1     [3566181, 3567876]      *   |    MACS_peak_4    558.89
     [5]     chr1     [3816545, 3818111]      *   |    MACS_peak_5     57.57
     ...      ...                    ...    ... ...            ...       ...
  [1327]     chrX [135244782, 135245821]      *   | MACS_peak_1327     55.54
  [1328]     chrX [139171963, 139173506]      *   | MACS_peak_1328    270.19
  [1329]     chrX [139583953, 139586126]      *   | MACS_peak_1329    918.73
  [1330]     chrX [139592001, 139593238]      *   | MACS_peak_1330    210.88
  [1331]     chrY [ 13845133,  13845777]      *   | MACS_peak_1331     58.39
  ---
  seqlengths:
    chr1 chr10 chr11 chr12 chr13 chr14 ...  chr6  chr7  chr8  chr9  chrX  chrY
      NA    NA    NA    NA    NA    NA ...    NA    NA    NA    NA    NA    NA
> covplot(peak, weightCol="V5")

Continue reading

I used R package ChIPpeakAnno for annotating peaks, and found that it handle the DNA strand in the wrong way. Maybe the developers were from the computer science but not biology background.

> require(ChIPpeakAnno)
> packageVersion("ChIPpeakAnno")
[1] '2.10.0'
> peak <- RangedData(space="chr1", IRanges(24736757, 24737528))
> data(TSS.human.GRCh37)
> ap <- annotatePeakInBatch(peak, Annotation=TSS.human.GRCh37)
> ap
RangedData with 1 row and 9 value columns across 1 space
                     space               ranges |        peak      strand
                               |  
1 ENSG00000001461        1 [24736757, 24737528] |           1           +
                          feature start_position end_position insideFeature
                                   
1 ENSG00000001461 ENSG00000001461       24742284     24799466      upstream
                  distancetoFeature shortestDistance fromOverlappingOrNearest
                                                
1 ENSG00000001461             -5527             4756             NearestStart

Continue reading

Author's picture

Guangchuang Yu

Bioinformatics Professor @ SMU

Bioinformatics Professor

Guangzhou