出错的原因在于,我根本就没给GSEA分析的结果写barplot方法,所以默认去调用graphics::barplot.default了,于是出错。
但这样的图,对于我们来说,简直简单的不要不要的。
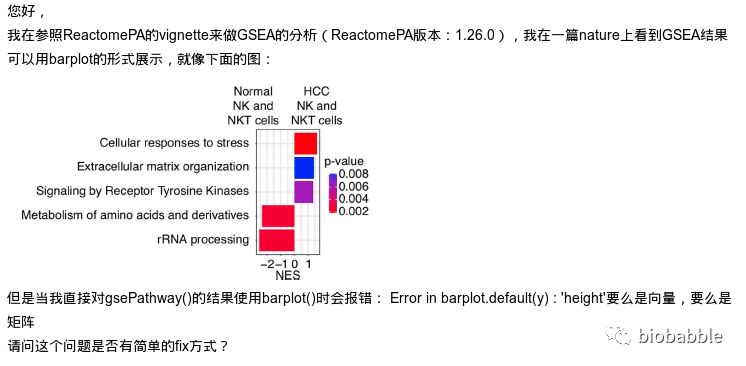
首先跑一下GSEA的分析, 这里用ReactomePA来跑一下通路的GSEA分析:

出错的原因在于,我根本就没给GSEA分析的结果写barplot方法,所以默认去调用graphics::barplot.default了,于是出错。
但这样的图,对于我们来说,简直简单的不要不要的。
首先跑一下GSEA的分析, 这里用ReactomePA来跑一下通路的GSEA分析:

I have been using clusterProfiler, which is a very useful package for gene set analysis and visualisation. I would like to use the ‘cnetplot’ function to plot a network of GO terms and the related genes. However for larger networks, the automatic display can be confusing and it would be helpful to be able to move nodes around. In the past I could do this with with cnetplot(fixed=FALSE) option, but after updating R and re-installing clusterProfiler, the output remains static.
I am using R 3.5.3 with clusterProfiler v3.10.1 which I installed using Bioconductor 3.8. I have installed and loaded the ‘igraph’ package, and the following test code produces output in an interactive window, as desired:
library(igraph) g <- make_ring(10) tkplot(g)
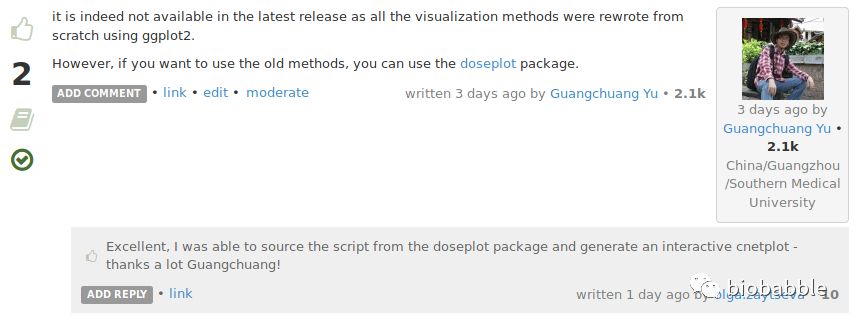
Is there any way to make cnetplot output interactive, or is that functionality simply not available in the latest release?
Any help would be greatly appreciated!

有一个叫CellMarker的数据库,专门收录组织和细胞的基因标记物,收录还比较全,而且是手工校对的(可怜一下干这种脏活的研究生三秒钟)。
By manually curating over 100 000 published papers, 4124 entries including the cell marker information, tissue type, cell type, cancer information and source, were recorded. At last, 13 605 cell markers of 467 cell types in 158 human tissues/sub-tissues and 9148 cell makers of 389 cell types in 81 mouse tissues/sub-tissues were collected and deposited in CellMarker.
有一些软件做了检验之后,是不告诉你那些基因在某个富集的通路中,显然做为生物学家,是对此有兴趣的。clusterProfiler系列,全部函数都会输出,但看基因ID,比如ENTREZID或ENSEMBLE,这些都对人类不友好,看了你也不知道是什么,为了让大家看结果的时候,还能有点感觉,我们需要把基因翻译成symbol,有那么一批函数比如DO、GO、Reactome的分析都是有readable参数的,但有一些是没有这个参数的,我被问得最多的是KEGG的分析为什么没有!
首先GO为什么有?因为enrichGO和gseGO都是使用OrgDb,而OrgDb本身带有ID转换的注释,而KEGG是在线去检索KEGG数据库的,KEGG并没有提供这些信息,当然对于少量大家比较熟悉的模式生物,要支持还是很容易的,然而有些物种支持,有些不支持,大家又会问了,凭什么我做的物种被BS了。所以啊,大家都不支持,挺公平。其实KEGG数据库里那么多的生物,很多物种是没有基因名的,有很多生物的注释还停留在基因座,你让我帮你转ID,臣妾做不到啊。
但起码对能支持的物种支持一下呗,以我一贯的作风,能帮小白解决的小问题,我都会去解决。于是我们有setReadable函数。但凡你能找到一个OrgDb,你就能用来转ID,就这样。
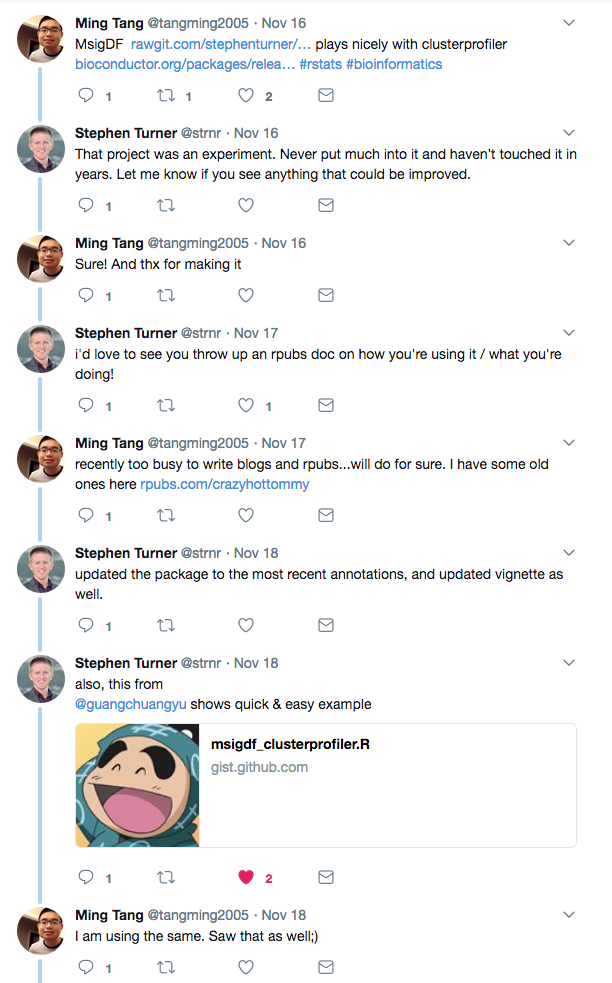
生信界的网红Stephen Turner在github上有个msigdf的包,我在他写这个包的时候,就写了个gist,连接clusterProfiler,我写gist的时候是2016年的8月,很高兴网红还惦记着我的gist。
msigdf这个包把著名的Broad Institute著名的Molecular Signatures Database (MSigDB)数据以data frame的形式打包成R包,这样子非常方便使用,当然他后来没有更新,而一个fork的版本,ToledoEM/msigdf把数据更新为最新版本v6.2,发布于2018年7月。
做科研我们不爽的是没有结果,比结果更不爽的是结果不符合预期,故事不知道该怎么编,然而戏真的不要太多,学术不是以预期来驱动的,请尊重一下事实,还有你的小鼠。
we had a quick email exchange about this and I would like to report this. (I appologise for contacting you directly, rather than following the submission guideline). I have a dataset with 6166 proteins of which 201 proteins are upregulated. The problem is that specifying the background proteins using universe argument in clusterProfiler, decreases the number of significant GO categories (28 significant categories without the universe argument and 5 with this argument). At the same time when I use online GORILLA tool I get a lot of categories, with the background:
http://cbl-gorilla.cs.technion.ac.il/GOrilla/kwpgie9l/GOResults.html
and not categories without the background:
http://cbl-gorilla.cs.technion.ac.il/GOrilla/5y4n3hn1/GOResults.html
I am not sure whether this is a bug or not, so I decided to report it here
The dataset is presented below …
allProtUGO <- enrichGO(gene = upRegProt, OrgDb = org.Hs.eg.db, keyType = "UNIPROT", ont='ALL', pool = TRUE,
qvalueCutoff = 0.05)
identifiedProtUGO <- enrichGO(gene = upRegProt, OrgDb = org.Hs.eg.db, keyType = “UNIPROT”, ont=‘ALL’, pool = TRUE, qvalueCutoff = 0.05, universe = backgroundProt)
dim (allProtUGO@result) dim (identifiedProtUGO@result)
「知识星球」里的问题,https://t.zsxq.com/aEyneA2,拟南芥的ID怎么搞,这个内置是支持的。
比如我随便搞几个ID来演示一下:
> require(clusterProfiler)
Loading required package: clusterProfiler

clusterProfiler v3.9.0  For help: https://guangchuangyu.github.io/software/clusterProfiler

If you use clusterProfiler in published research, please cite:
Guangchuang Yu, Li-Gen Wang, Yanyan Han, Qing-Yu He. clusterProfiler: an R package for
comparing biological themes among gene clusters. OMICS: A Journal of Integrative Biology. 2012, 16(5):284-287.

g <- c("AT5G61600", "AT2G44230", "AT1G49130", "AT1G30310", "AT3G18560",
"AT2G15960", "AT2G29290", "AT1G08930", "AT2G44460", "AT3G46600",
"AT5G24380", "AT3G59270", "AT5G55780", "AT2G45090", "AT5G38430",
"AT2G17040", "AT4G35770", "AT5G30341", "AT1G56320", "AT2G16367")
