After the release of meme package, I received several feedbacks from users.
The most usefule one is the comment on my blog post:
Greetings Mr. Yu,
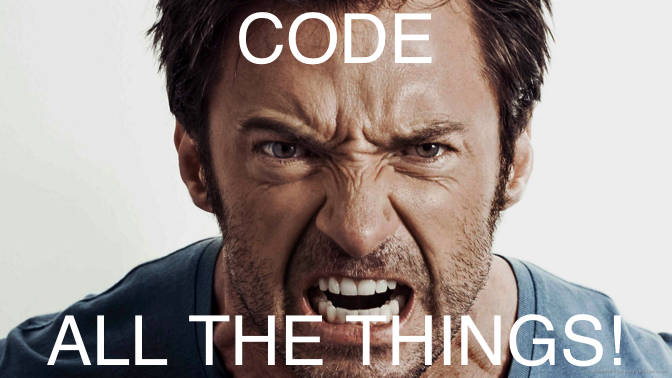
I am very happy that this package exists. Thank you for making it! I would like to request a feature, to ensure the package is able to compete with professional meme-creation tools like memegenerator and paint.net. Since memes often use the font Impact, in white and with black outline, I believe the package would be more powerful if it also did that automatically.
Regards,
The words, ‘compete with professional meme-creation tools’, stimulated me to develop text plotting with background outline effect.
Now this feature is available in meme v>=0.0.7, which can be downloaded from CRAN.